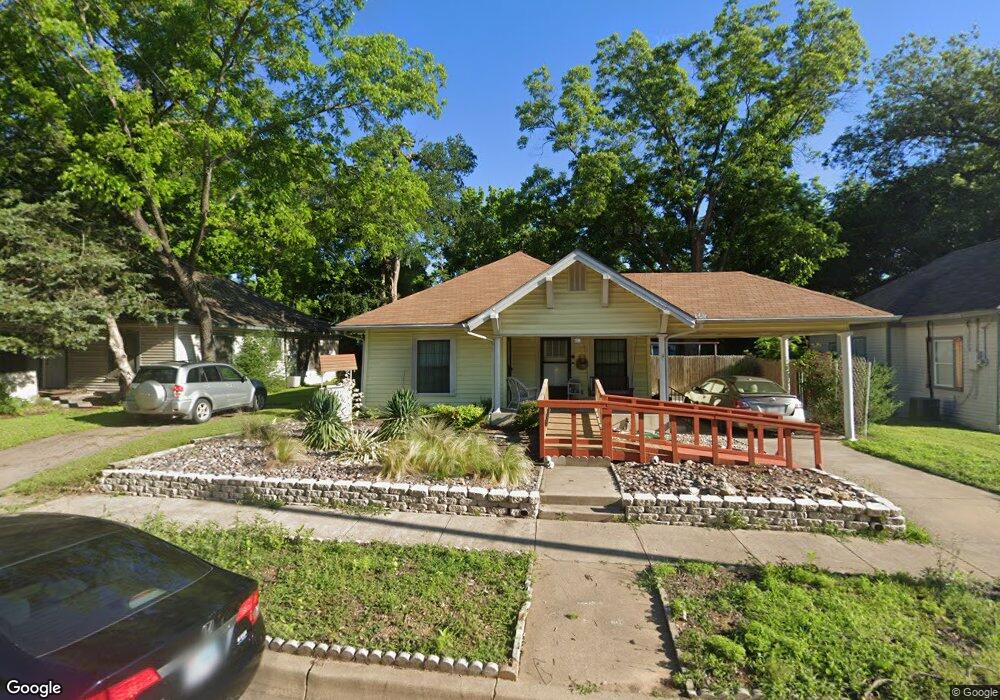
412 W Wardville St Cleburne, TX 76033
Estimated Value: $157,000 - $201,000
3
Beds
1
Bath
1,320
Sq Ft
$138/Sq Ft
Est. Value
About This Home
This home is located at 412 W Wardville St, Cleburne, TX 76033 and is currently estimated at $182,380, approximately $138 per square foot. 412 W Wardville St is a home located in Johnson County with nearby schools including Coleman Elementary School, A.D. Wheat Middle School, and Cleburne High School.
Ownership History
Date
Name
Owned For
Owner Type
Purchase Details
Closed on
Nov 24, 2021
Sold by
Martha Thigpen
Bought by
Thigpen Martha and Thigpen David Neil
Current Estimated Value
Home Financials for this Owner
Home Financials are based on the most recent Mortgage that was taken out on this home.
Original Mortgage
$53,350
Interest Rate
2.42%
Mortgage Type
New Conventional
Purchase Details
Closed on
Apr 29, 2021
Sold by
Thigpen Martha
Bought by
Thigpen David
Purchase Details
Closed on
Apr 25, 2019
Sold by
Bradley Christopher Kinny and Estate Of Brooks Bradley
Bought by
Bradley Sylvia Elaine
Purchase Details
Closed on
Apr 5, 2018
Sold by
Thigpen Martha
Bought by
Thigpen David
Purchase Details
Closed on
Apr 10, 2013
Sold by
Barber Helen A and The Barber Family Trust
Bought by
Barber Helen A
Purchase Details
Closed on
Mar 22, 2005
Sold by
Bank Of America Na
Bought by
Galloway Carolyn Estes
Create a Home Valuation Report for This Property
The Home Valuation Report is an in-depth analysis detailing your home's value as well as a comparison with similar homes in the area
Home Values in the Area
Average Home Value in this Area
Purchase History
| Date | Buyer | Sale Price | Title Company |
|---|---|---|---|
| Thigpen Martha | -- | New Title Company Name | |
| Thigpen David | -- | None Listed On Document | |
| Bradley Sylvia Elaine | -- | None Available | |
| Thigpen David | -- | None Available | |
| Barber Helen A | -- | None Available | |
| Galloway Carolyn Estes | -- | None Available |
Source: Public Records
Mortgage History
| Date | Status | Borrower | Loan Amount |
|---|---|---|---|
| Previous Owner | Thigpen Martha | $53,350 |
Source: Public Records
Tax History Compared to Growth
Tax History
| Year | Tax Paid | Tax Assessment Tax Assessment Total Assessment is a certain percentage of the fair market value that is determined by local assessors to be the total taxable value of land and additions on the property. | Land | Improvement |
|---|---|---|---|---|
| 2025 | $355 | $131,021 | $28,000 | $103,021 |
| 2024 | $2,479 | $111,202 | $0 | $0 |
| 2023 | $355 | $131,021 | $28,000 | $103,021 |
| 2022 | $2,300 | $131,021 | $28,000 | $103,021 |
| 2021 | $2,180 | $131,021 | $28,000 | $103,021 |
| 2020 | $2,105 | $91,772 | $20,000 | $71,772 |
| 2019 | $2,040 | $91,772 | $20,000 | $71,772 |
| 2018 | $1,856 | $62,771 | $13,000 | $49,771 |
| 2017 | $1,848 | $62,771 | $13,000 | $49,771 |
| 2016 | $1,731 | $61,271 | $11,500 | $49,771 |
| 2015 | $383 | $53,442 | $13,500 | $39,942 |
| 2014 | $383 | $53,442 | $13,500 | $39,942 |
Source: Public Records
Map
Nearby Homes
- 220 W Wardville St
- 216 W Willingham St
- 507 N Buffalo Ave
- 1033 Spring Azure Dr
- 5540-5556 County Road 406
- 8225 Farm To Market 1434
- 204 S Walnut St
- 709 N Buffalo Ave
- 302 S Wood St
- 702 N Walnut St
- 407 N Wilhite St
- 114 S Field St
- 312 N Wood St
- 603 N Anglin St
- 306 Prairie Ave
- 618 Granbury St
- 415 Featherston St
- 612 N Robinson St
- 104 Dixon St
- 614 N Robinson St
- 414 W Wardville St
- 406 W Wardville St
- 211 W Brown St
- 411 W Wardville St
- 418 W Wardville St
- 209 W Brown St
- 215 W Brown St
- 207 W Brown St
- 404 W Wardville St
- 405 W Wardville St
- 217 W Brown St
- 422 W Wardville St
- 402 W Wardville St
- 413 W Wardville St
- 401 W Wardville St
- 307 N Buffalo Ave
- 419 W Wardville St
- 219 W Brown St
- 210 W Brown St
- 208 W Brown St