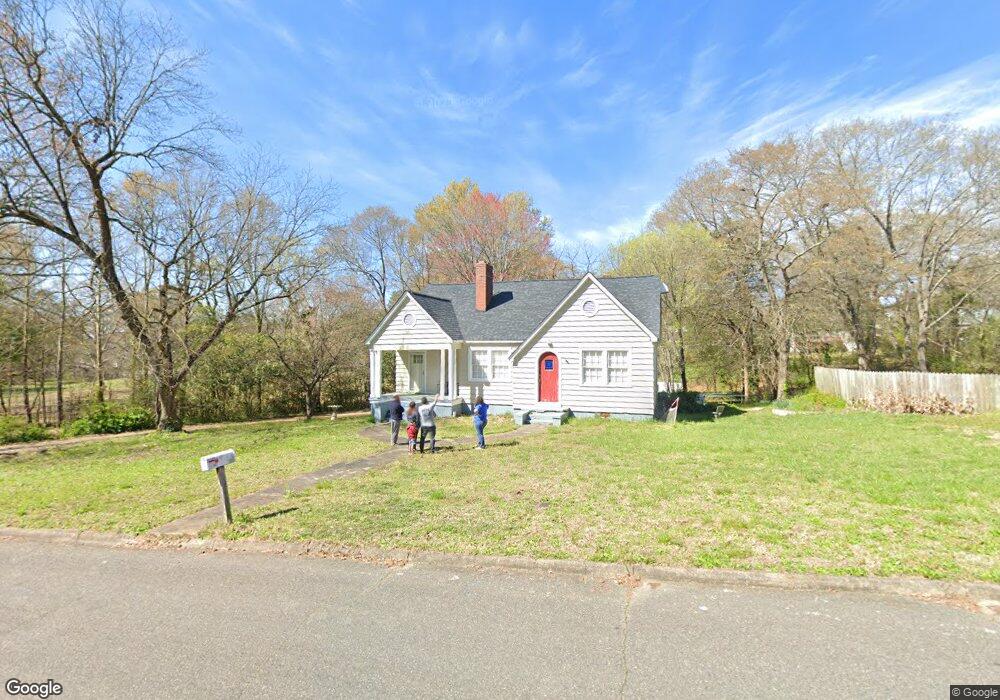
412 Whisnant St Shelby, NC 28150
Estimated Value: $119,000 - $214,000
--
Bed
--
Bath
1,465
Sq Ft
$106/Sq Ft
Est. Value
About This Home
This home is located at 412 Whisnant St, Shelby, NC 28150 and is currently estimated at $155,651, approximately $106 per square foot. 412 Whisnant St is a home located in Cleveland County with nearby schools including Graham Elementary School, Shelby Middle School, and Shelby High School.
Ownership History
Date
Name
Owned For
Owner Type
Purchase Details
Closed on
Mar 22, 2021
Sold by
Stephens James A and Stephens Patricia
Bought by
Collins Tresha and Collins Brett
Current Estimated Value
Home Financials for this Owner
Home Financials are based on the most recent Mortgage that was taken out on this home.
Original Mortgage
$80,808
Outstanding Balance
$72,439
Interest Rate
2.7%
Mortgage Type
New Conventional
Estimated Equity
$83,212
Purchase Details
Closed on
Jun 28, 2018
Sold by
Worthern Terrie Rippy and Worthern Michael
Bought by
Stephens James A and Stephens Jimmy
Create a Home Valuation Report for This Property
The Home Valuation Report is an in-depth analysis detailing your home's value as well as a comparison with similar homes in the area
Home Values in the Area
Average Home Value in this Area
Purchase History
| Date | Buyer | Sale Price | Title Company |
|---|---|---|---|
| Collins Tresha | $80,000 | None Available | |
| Stephens James A | $24,000 | None Available |
Source: Public Records
Mortgage History
| Date | Status | Borrower | Loan Amount |
|---|---|---|---|
| Open | Collins Tresha | $80,808 |
Source: Public Records
Tax History Compared to Growth
Tax History
| Year | Tax Paid | Tax Assessment Tax Assessment Total Assessment is a certain percentage of the fair market value that is determined by local assessors to be the total taxable value of land and additions on the property. | Land | Improvement |
|---|---|---|---|---|
| 2025 | $1,039 | $104,467 | $27,160 | $77,307 |
| 2024 | $247 | $20,465 | $13,580 | $6,885 |
| 2023 | $245 | $20,465 | $13,580 | $6,885 |
| 2022 | $245 | $20,465 | $13,580 | $6,885 |
| 2021 | $247 | $20,465 | $13,580 | $6,885 |
| 2020 | $261 | $19,255 | $11,271 | $7,984 |
| 2019 | $261 | $19,255 | $11,271 | $7,984 |
| 2018 | $260 | $19,255 | $11,271 | $7,984 |
| 2017 | $254 | $19,255 | $11,271 | $7,984 |
| 2016 | $253 | $19,255 | $11,271 | $7,984 |
| 2015 | $431 | $35,709 | $11,271 | $24,438 |
| 2014 | $431 | $35,709 | $11,271 | $24,438 |
Source: Public Records
Map
Nearby Homes