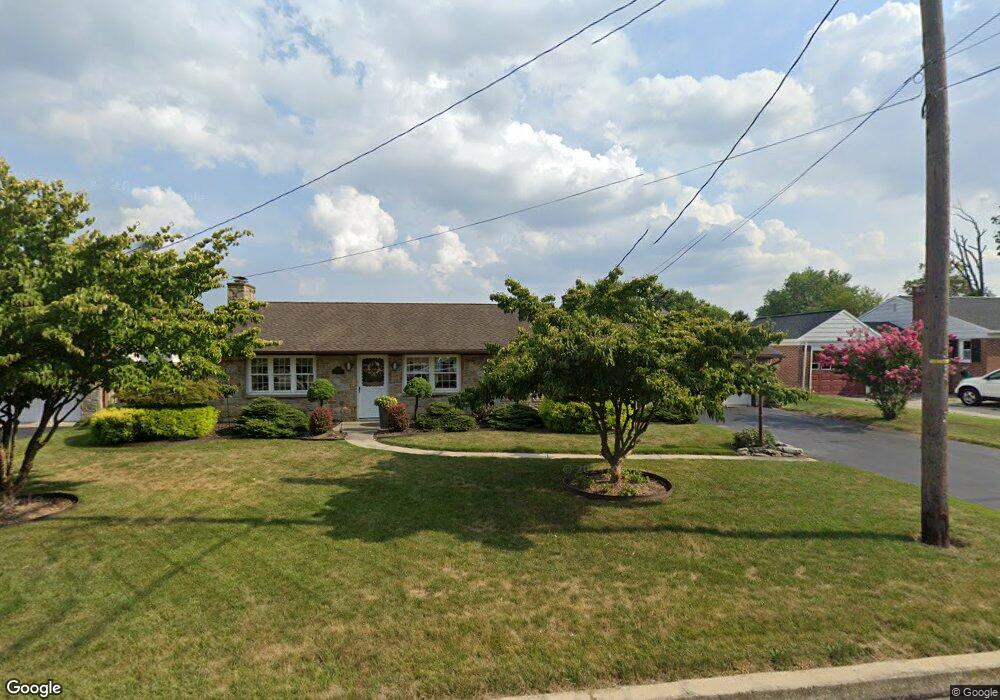
4120 Grandview Rd Hanover, PA 17331
Estimated Value: $252,720 - $280,000
2
Beds
1
Bath
1,280
Sq Ft
$208/Sq Ft
Est. Value
About This Home
This home is located at 4120 Grandview Rd, Hanover, PA 17331 and is currently estimated at $266,430, approximately $208 per square foot. 4120 Grandview Rd is a home located in York County with nearby schools including South Western Senior High School, St Joseph Catholic School, and Hope Christian School Of Hanover.
Ownership History
Date
Name
Owned For
Owner Type
Purchase Details
Closed on
Apr 26, 2002
Sold by
Garrett Shawn D and Garrett Jamie M
Bought by
Garrett Shawn D and Garrett Jamie M
Current Estimated Value
Home Financials for this Owner
Home Financials are based on the most recent Mortgage that was taken out on this home.
Original Mortgage
$112,300
Outstanding Balance
$48,087
Interest Rate
7.13%
Estimated Equity
$218,343
Purchase Details
Closed on
Jan 27, 2000
Sold by
Dipaolo Richard F
Bought by
Garrett Shawn D and Riddle Jamie M
Home Financials for this Owner
Home Financials are based on the most recent Mortgage that was taken out on this home.
Original Mortgage
$112,500
Interest Rate
7.83%
Purchase Details
Closed on
Nov 25, 1998
Sold by
Hahn Barbara L
Bought by
Dipaolo Richard F
Home Financials for this Owner
Home Financials are based on the most recent Mortgage that was taken out on this home.
Original Mortgage
$50,000
Interest Rate
6.83%
Create a Home Valuation Report for This Property
The Home Valuation Report is an in-depth analysis detailing your home's value as well as a comparison with similar homes in the area
Home Values in the Area
Average Home Value in this Area
Purchase History
| Date | Buyer | Sale Price | Title Company |
|---|---|---|---|
| Garrett Shawn D | -- | -- | |
| Garrett Shawn D | $118,500 | -- | |
| Dipaolo Richard F | $110,000 | -- |
Source: Public Records
Mortgage History
| Date | Status | Borrower | Loan Amount |
|---|---|---|---|
| Open | Garrett Shawn D | $112,300 | |
| Closed | Garrett Shawn D | $112,500 | |
| Previous Owner | Dipaolo Richard F | $50,000 |
Source: Public Records
Tax History Compared to Growth
Tax History
| Year | Tax Paid | Tax Assessment Tax Assessment Total Assessment is a certain percentage of the fair market value that is determined by local assessors to be the total taxable value of land and additions on the property. | Land | Improvement |
|---|---|---|---|---|
| 2025 | $4,692 | $139,220 | $41,830 | $97,390 |
| 2024 | $4,692 | $139,220 | $41,830 | $97,390 |
| 2023 | $4,608 | $139,220 | $41,830 | $97,390 |
| 2022 | $4,509 | $139,220 | $41,830 | $97,390 |
| 2021 | $4,263 | $139,220 | $41,830 | $97,390 |
| 2020 | $4,263 | $139,220 | $41,830 | $97,390 |
| 2019 | $4,181 | $139,220 | $41,830 | $97,390 |
| 2018 | $4,126 | $139,220 | $41,830 | $97,390 |
| 2017 | $4,030 | $139,220 | $41,830 | $97,390 |
| 2016 | $0 | $139,220 | $41,830 | $97,390 |
| 2015 | -- | $139,220 | $41,830 | $97,390 |
| 2014 | -- | $139,220 | $41,830 | $97,390 |
Source: Public Records
Map
Nearby Homes
- 14 Garden Ln
- 141 Windsor Ct
- 18 Cardinal Dr
- 22 Meadow Ln Unit 19
- 201 Fieldstone Dr Unit 23
- 32 Kaitlyn Dr
- 520 Ripple Dr Unit 49
- 440 Ripple Dr Unit 52
- 430 Ripple Dr Unit 53
- 420 Ripple Dr Unit 54
- 570 Ripple Dr Unit 44
- 6 Little Way Unit 64
- 5 Little Way Unit 65
- 445 Ripple Dr Unit 61
- 405 Ripple Dr Unit 57
- 1520 Maple Ln Unit 71
- 1 Little Way Unit 79
- 104 Stonewicke Dr Unit 86
- 115 Stonewicke Dr Unit 96
- 1202 Baltimore St
- 4124 Grandview Rd
- 4112 Grandview Rd
- 51 Cardinal Dr
- 49 Cardinal Dr
- 53 Cardinal Dr
- 4110 Grandview Rd
- 47 Cardinal Dr
- 4136 Grandview Rd
- 4123 Grandview Rd
- 4125 Grandview Rd
- 45 Cardinal Dr
- 4135 Grandview Rd
- 50 Cardinal Dr
- 48 Cardinal Dr
- 4102 Grandview Rd
- 52 Cardinal Dr Hanover Pennsylvania
- 52 Cardinal Dr
- 4111 Grandview Rd
- 46 Cardinal Dr
- 4138 Grandview Rd