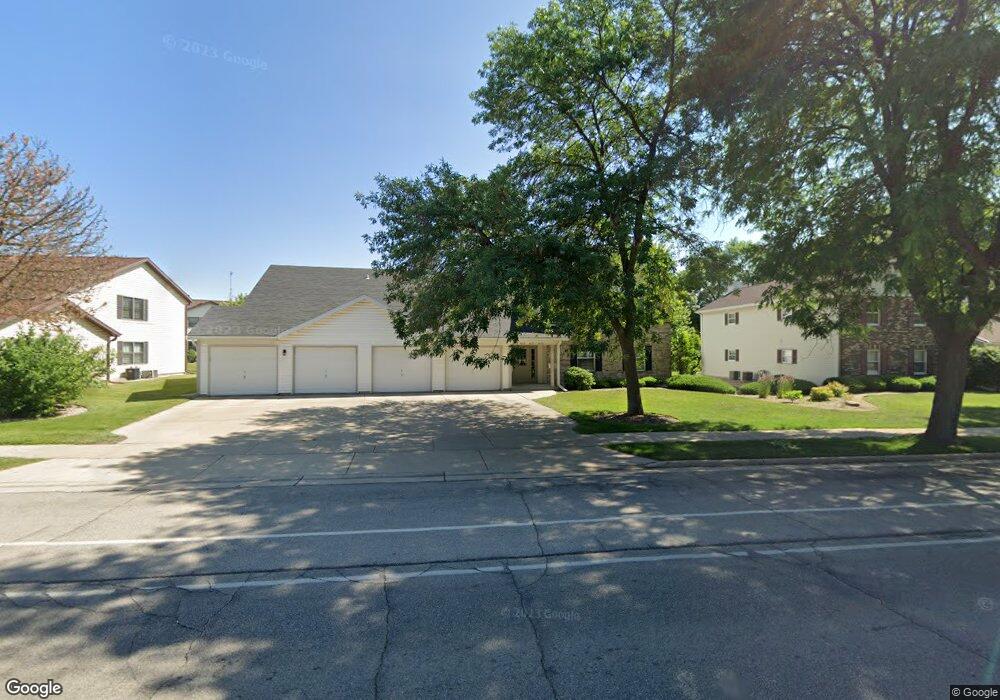
4121 80th St Unit 14C Kenosha, WI 53142
Lance NeighborhoodEstimated Value: $235,000 - $241,000
2
Beds
2
Baths
1,424
Sq Ft
$167/Sq Ft
Est. Value
About This Home
This home is located at 4121 80th St Unit 14C, Kenosha, WI 53142 and is currently estimated at $237,330, approximately $166 per square foot. 4121 80th St Unit 14C is a home located in Kenosha County with nearby schools including Whittier Elementary School, Lance Middle School, and Tremper High School.
Ownership History
Date
Name
Owned For
Owner Type
Purchase Details
Closed on
May 15, 2013
Sold by
Sylejmani Mahmut and Sylejmani Hamide
Bought by
Knaup Janice L
Current Estimated Value
Home Financials for this Owner
Home Financials are based on the most recent Mortgage that was taken out on this home.
Original Mortgage
$75,900
Outstanding Balance
$53,880
Interest Rate
3.52%
Mortgage Type
New Conventional
Estimated Equity
$183,450
Purchase Details
Closed on
Jul 31, 2012
Sold by
Wohlgemuth Frank A
Bought by
Sylejmani Mahmut and Sylejmani Hamide
Purchase Details
Closed on
Jul 26, 2012
Sold by
Wohlgemuth Leonard
Bought by
Sylejmani Mahmut and Sylejmani Hamide
Purchase Details
Closed on
Jul 25, 2012
Sold by
Wohlgemuth Suzanne M
Bought by
Sylejmani Mahmut and Sylejmani Hamide
Create a Home Valuation Report for This Property
The Home Valuation Report is an in-depth analysis detailing your home's value as well as a comparison with similar homes in the area
Home Values in the Area
Average Home Value in this Area
Purchase History
| Date | Buyer | Sale Price | Title Company |
|---|---|---|---|
| Knaup Janice L | $94,900 | None Available | |
| Sylejmani Mahmut | $22,000 | Knight Barry Title Inc | |
| Sylejmani Mahmut | $22,500 | Knight Barry Title Inc | |
| Sylejmani Mahmut | $22,500 | Knight Barry Title Inc |
Source: Public Records
Mortgage History
| Date | Status | Borrower | Loan Amount |
|---|---|---|---|
| Open | Knaup Janice L | $75,900 |
Source: Public Records
Tax History Compared to Growth
Tax History
| Year | Tax Paid | Tax Assessment Tax Assessment Total Assessment is a certain percentage of the fair market value that is determined by local assessors to be the total taxable value of land and additions on the property. | Land | Improvement |
|---|---|---|---|---|
| 2024 | $2,596 | $114,000 | $13,500 | $100,500 |
| 2023 | $2,596 | $114,000 | $13,500 | $100,500 |
| 2022 | $2,635 | $114,000 | $13,500 | $100,500 |
| 2021 | $2,698 | $114,000 | $13,500 | $100,500 |
| 2020 | $2,803 | $114,000 | $13,500 | $100,500 |
| 2019 | $2,689 | $114,000 | $13,500 | $100,500 |
| 2018 | $2,646 | $97,400 | $13,500 | $83,900 |
| 2017 | $2,497 | $97,400 | $13,500 | $83,900 |
| 2016 | $2,438 | $97,400 | $13,500 | $83,900 |
| 2015 | $2,142 | $82,900 | $13,500 | $69,400 |
| 2014 | $2,121 | $82,900 | $13,500 | $69,400 |
Source: Public Records
Map
Nearby Homes
- 8040 42nd Ave Unit 13A
- 4222 80th Place Unit 19D
- 8037 41st Ave Unit 29C
- 4117 79th St
- 7840 43rd Ave
- 7817 43rd Ave
- 7908 46th Ave
- 7715 Pershing Blvd
- 4016 83rd Place
- 8306 42nd Ave
- 7601 Pershing Blvd
- 8106 48th Ave
- 8008 49th Ave
- 3321 80th St
- 3920 75th St
- 7409 Pershing Blvd
- 3128 85th St
- 7813 32nd Ave
- 3502 75th St
- 7205 41st Ave
- 4119 80th St Unit 14B
- 4117 80th St Unit 14A
- 4106 80th St
- 4201 80th St Unit 1B
- 4203 80th St Unit 1A
- 4205 80th St Unit 1D
- 4207 80th St Unit 1C
- 4116 80th St Unit 23C
- 4110 80th St
- 4217 80th St Unit 2A
- 7954 42nd Ave
- 4219 80th St Unit 2B
- 4221 80th St Unit 2C
- 4223 80th St Unit 2D
- 4105 80th St Unit 28D
- 4105 80th St Unit D
- 4210 80th St
- 7945 42nd Ave
- 7944 42nd Ave
- 4223 80 St Unit 2D