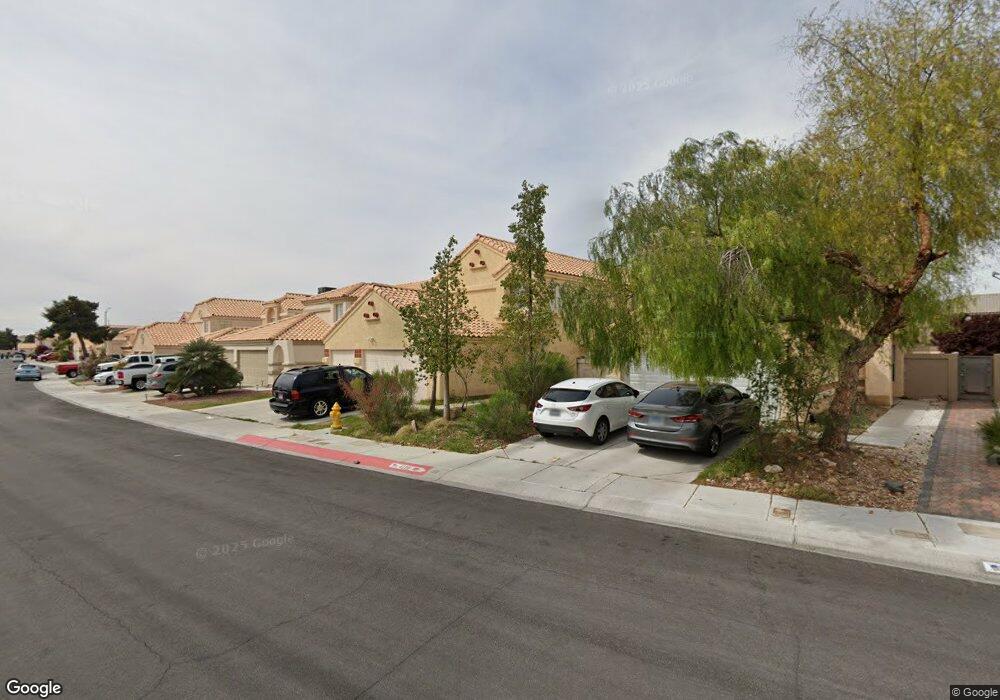
4121 Browndeer Cir Las Vegas, NV 89129
Lone Mountain NeighborhoodEstimated Value: $453,600 - $477,000
4
Beds
3
Baths
2,143
Sq Ft
$218/Sq Ft
Est. Value
About This Home
This home is located at 4121 Browndeer Cir, Las Vegas, NV 89129 and is currently estimated at $466,900, approximately $217 per square foot. 4121 Browndeer Cir is a home located in Clark County with nearby schools including Marc Kahre Elementary School, Dorothy Eisenberg Elementary School, and Justice Myron E Leavitt Middle School.
Ownership History
Date
Name
Owned For
Owner Type
Purchase Details
Closed on
Jan 20, 2005
Sold by
Ruiz Anita
Bought by
Vailahi Wesley R and Vailahi Vikatolia
Current Estimated Value
Home Financials for this Owner
Home Financials are based on the most recent Mortgage that was taken out on this home.
Original Mortgage
$232,000
Outstanding Balance
$112,223
Interest Rate
5.12%
Mortgage Type
Unknown
Estimated Equity
$354,677
Purchase Details
Closed on
May 24, 2000
Sold by
Fiore Peter J and Fiore Jill G
Bought by
Ruiz Anita
Home Financials for this Owner
Home Financials are based on the most recent Mortgage that was taken out on this home.
Original Mortgage
$115,200
Interest Rate
10%
Purchase Details
Closed on
Aug 6, 1996
Sold by
Biel Chito and Biel Diana
Bought by
Fiore Peter J and Fiore Jill G
Home Financials for this Owner
Home Financials are based on the most recent Mortgage that was taken out on this home.
Original Mortgage
$120,650
Interest Rate
8.23%
Create a Home Valuation Report for This Property
The Home Valuation Report is an in-depth analysis detailing your home's value as well as a comparison with similar homes in the area
Home Values in the Area
Average Home Value in this Area
Purchase History
| Date | Buyer | Sale Price | Title Company |
|---|---|---|---|
| Vailahi Wesley R | $290,000 | First Amer Title Co Of Nv | |
| Ruiz Anita | $144,000 | Fidelity National Title | |
| Fiore Peter J | $127,000 | United Title |
Source: Public Records
Mortgage History
| Date | Status | Borrower | Loan Amount |
|---|---|---|---|
| Open | Vailahi Wesley R | $232,000 | |
| Previous Owner | Ruiz Anita | $115,200 | |
| Previous Owner | Fiore Peter J | $120,650 | |
| Closed | Ruiz Anita | $28,800 | |
| Closed | Vailahi Wesley R | $58,000 |
Source: Public Records
Tax History Compared to Growth
Tax History
| Year | Tax Paid | Tax Assessment Tax Assessment Total Assessment is a certain percentage of the fair market value that is determined by local assessors to be the total taxable value of land and additions on the property. | Land | Improvement |
|---|---|---|---|---|
| 2025 | $1,970 | $91,244 | $33,600 | $57,644 |
| 2024 | $2,803 | $91,244 | $33,600 | $57,644 |
| 2023 | $1,519 | $84,233 | $28,700 | $55,533 |
| 2022 | $1,525 | $75,195 | $24,150 | $51,045 |
| 2021 | $1,481 | $70,286 | $21,350 | $48,936 |
| 2020 | $1,435 | $57,146 | $21,000 | $36,146 |
| 2019 | $1,417 | $68,415 | $19,950 | $48,465 |
| 2018 | $1,352 | $62,126 | $15,400 | $46,726 |
| 2017 | $2,032 | $61,986 | $14,350 | $47,636 |
| 2016 | $1,519 | $56,233 | $10,500 | $45,733 |
| 2015 | $1,759 | $48,235 | $9,100 | $39,135 |
| 2014 | $1,524 | $41,754 | $5,950 | $35,804 |
Source: Public Records
Map
Nearby Homes
- 4109 Glenfield Cir
- 4061 Browndeer Cir
- 7223 Hollywood Park Ave
- 4053 Hazelridge Dr
- 4224 Perfect Drift St
- 7251 Daily Double Ave
- 4025 Cunning Fellow Ct
- 4025 Sea Hero St
- 4021 Sea Hero St Unit 1
- 4252 Olympic Point Dr
- 3351 Dancing Waters St
- 3344 Dancing Waters St
- 3350 Dancing Waters St
- 4205 Thunder Twice St
- 4052 Cape Sand Dr
- 4356 Perfect Drift St
- 7349 Dolphine Crest Ave
- 7408 Summer Crest Ln
- 6900 Quail Hollow Dr
- 7418 Lawrence Powers Ct
- 4125 Browndeer Cir
- 4117 Browndeer Cir
- 4129 Browndeer Cir
- 4113 Browndeer Cir
- 4133 Browndeer Cir
- 4109 Browndeer Cir
- 4137 Browndeer Cir
- 4120 Browndeer Cir
- 4124 Browndeer Cir
- 4116 Browndeer Cir
- 4128 Browndeer Cir
- 4105 Browndeer Cir Unit 1
- 4105 Browndeer Cir
- 4112 Browndeer Cir Unit 4
- 4132 Browndeer Cir
- 4141 Browndeer Cir
- 4120 Perfect Lure St
- 4116 Perfect Lure St
- 4108 Browndeer Cir
- 4101 Browndeer Cir