NOT LISTED FOR SALE

4121 Herron Trail SW Unit 11C Atlanta, GA 30349

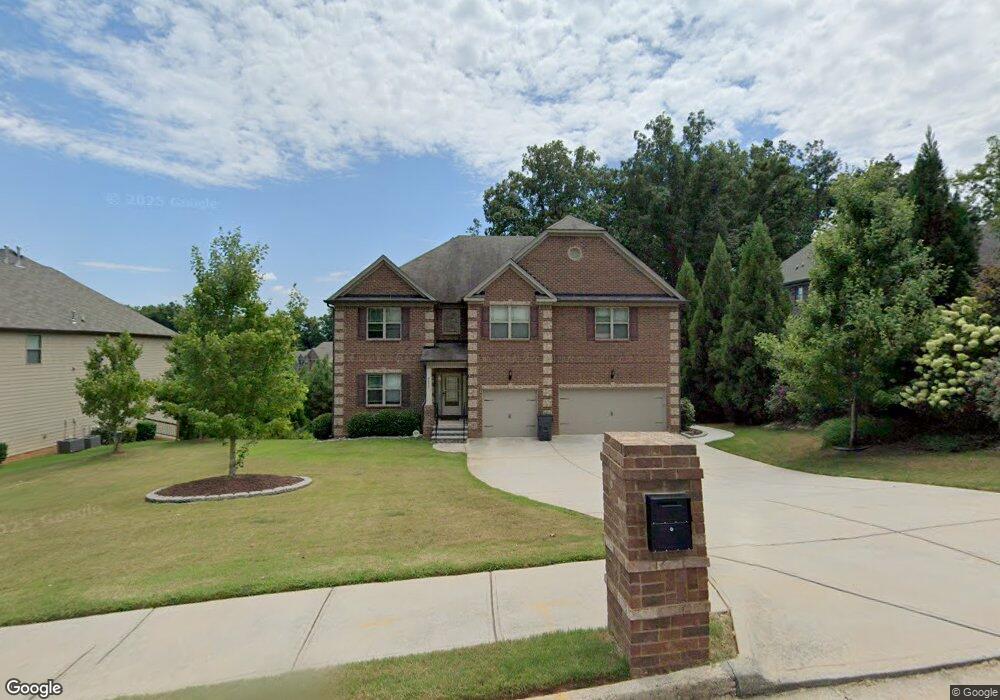
Estimated Value: $625,000 - $670,000

4 Beds
4 Baths
5,109 Sq Ft
$127/Sq Ft Est. Value

Last Sold December 10, 2012

Last sale price $306,585 $60 Per Sq Ft

Est. 112% increase in value since last sale

Current estimated payment $3,858/month

About This Home

Jefferson 2: New Plan! 5br/3.5Ba! Library, Formal Dining, Open Family Rm, Gourmet Kitchen, Keeping Rm; 2nd floor Loft, Master sitting rm w/fplc, Teen suite. Swim/Tennis. Minutes from shopping!

Ownership History

Date Name Owned For Owner Type

Purchase Details

Listed on
May 7, 2012
Closed on
Dec 10, 2012
Sold by
Jefferson Homes Inc
Bought by
Harris Roland and Branson Dawnette
Seller's Agent
Lele Richardson
NOT A VALID MEMBER
Buyer's Agent
LaTanya McGriggs
NOT A VALID MEMBER
List Price
$316,575
Sold Price
$306,585
Premium/Discount to List
-$9,990
-3.16%
Current Estimated Value
$650,686

Home Financials for this Owner

Home Financials are based on the most recent Mortgage that was taken out on this home.
Estimated Appreciation
$344,101
Avg. Annual Appreciation
5.95%
Original Mortgage
$316,794
Outstanding Balance
$220,106
Interest Rate
3.43%
Mortgage Type
VA
Estimated Equity
$430,580

Purchase Details

Closed on
May 8, 2012
Sold by
Mount Salem Circle Propert
Bought by
Jefferson Homes Inc
Source: Public Records

Range of Values:

--
Value Increase
--
Percent Increase
--
Adjusted for Inflation
Collateral Analytics

Collateral Analytics Collateral Analytics AVMs (Automated Valuation Model) employ a number of statistical approaches combined with neighborhood-specific comparable selection guarantees the most up-to-date and precise valuations.

Not Available

Collateral Analytics does not have data for the current month. Please view the chart for historical values.

ICE

ICE Mortgage Technology ICE Mortgage Technology’s AVM (Automated Valuation Model) is a state-of-the-art online residential property valuation tool that provides a quick and accurate estimate of the value of almost any home in the U.S.

Not Available

ICE Mortgage Technology does not have data for the current month. Please view the chart for historical values.

First American

First American First American Data & Analytics’ next-generation AVM combines unrivaled data assets with a blended ensemble of valuation models to produce highly accurate, reliable valuations you can trust.

Not Available

First American does not have data for the current month. Please view the chart for historical values.

Quantarium

Quantarium Quantarium’s valuation service, repeatedly proven the industry’s most accurate and comprehensive, is supercharged with a self-learning and auto-tuning AI engine that continually becomes smarter and more accurate as it processes daily inputs from the industry’s leading RE data lake.

Not Available

Quantarium does not have data for the current month. Please view the chart for historical values.

Average Value
Not Available
List Price
Sold Price
Create a Home Valuation Report for This Property
The Home Valuation Report is an in-depth analysis detailing your home's value as well as a comparison with similar homes in the area

Home Values in the Area

Source: Public Records

Average Home Value in this Area


Source: Public Records

Purchase History

Date Buyer Sale Price Title Company
Harris Roland -- --
Harris Roland $306,585 --
Jefferson Homes Inc $59,800 --
Source: Public Records

Mortgage History

Date Status Borrower Loan Amount
Open Harris Roland $316,794
Closed Harris Roland $316,794
Source: Public Records

Property History

Date Event Price List to Sale Price per Sq Ft Prior Sale
12/10/2012 12/10/12 Sold $306,585 -3.2% -- View Prior Sale
11/15/2012 11/15/12 Pending -- -- --
05/07/2012 05/07/12 For Sale $316,575 -- --

Tax History Compared to Growth

Source: Public Records

Tax History

Year Tax Paid Tax Assessment Tax Assessment Total Assessment is a certain percentage of the fair market value that is determined by local assessors to be the total taxable value of land and additions on the property. Land Improvement
2025 $4,769 $256,360 $38,880 $217,480
2023 $7,053 $249,880 $38,880 $211,000
2022 $4,673 $210,320 $35,080 $175,240
2021 $4,596 $198,520 $31,640 $166,880
2020 $4,587 $150,000 $16,480 $133,520
2019 $4,518 $150,000 $16,480 $133,520
2018 $4,432 $150,000 $16,480 $133,520
2017 $4,555 $134,400 $19,200 $115,200
2016 $4,567 $134,400 $19,200 $115,200
2015 $4,307 $134,400 $19,200 $115,200
2014 $4,510 $122,600 $17,560 $105,040
Source: Public Records

Agents Affiliated with this Home

  • Section Image
  • Section Image
  • Section Image
See All Agents

Map