4121 Jamestown St Cincinnati, OH 45205
West Price Hill NeighborhoodEstimated Value: $181,000 - $220,000
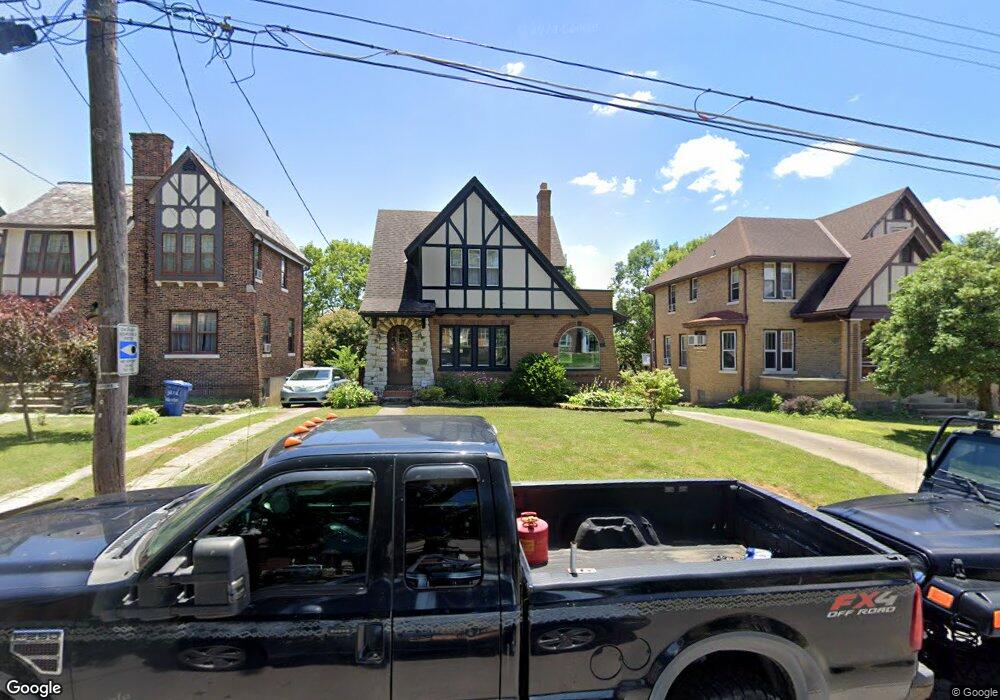
About This Home
This home is located at 4121 Jamestown St, Cincinnati, OH 45205 and is currently estimated at $203,662, approximately $127 per square foot. 4121 Jamestown St is a home located in Hamilton County with nearby schools including Carson School, Gilbert A. Dater High School, and Western Hills High School.
Ownership History
We collect this data history from publicly available records. To have your information removed, we recommend requesting removal directly through your county’s website.
Purchase Details
Home Financials for this Owner
Home Financials are based on the most recent Mortgage that was taken out on this home.Purchase Details
Home Financials for this Owner
Home Financials are based on the most recent Mortgage that was taken out on this home.Purchase Details
Home Financials for this Owner
Home Financials are based on the most recent Mortgage that was taken out on this home.Home Values in the Area
Average Home Value in this Area
Purchase History
We collect this data history from publicly available records. To have your information removed, we recommend requesting removal directly through your county’s website.
| Date | Buyer | Sale Price | Title Company |
|---|---|---|---|
| -- | Republic Title Agency Inc | ||
| $114,500 | -- | ||
| $82,000 | -- |
Mortgage History
We collect this data history from publicly available records. To have your information removed, we recommend requesting removal directly through your county’s website.
| Date | Status | Borrower | Loan Amount |
|---|---|---|---|
| Open | $115,425 | ||
| Closed | $91,600 | ||
| Closed | $65,600 |
Tax History
We collect this data history from publicly available records. To have your information removed, we recommend requesting removal directly through your county’s website.
| Year | Tax Paid | Tax Assessment Tax Assessment Total Assessment is a certain percentage of the fair market value that is determined by local assessors to be the total taxable value of land and additions on the property. | Land | Improvement |
|---|---|---|---|---|
| 2025 | $3,179 | $47,755 | $5,751 | $42,004 |
| 2023 | $3,154 | $47,755 | $5,751 | $42,004 |
| 2022 | $1,840 | $23,482 | $5,712 | $17,770 |
| 2021 | $1,547 | $23,482 | $5,712 | $17,770 |
| 2020 | $1,592 | $23,482 | $5,712 | $17,770 |
| 2019 | $1,581 | $21,347 | $5,194 | $16,153 |
| 2018 | $1,584 | $21,347 | $5,194 | $16,153 |
| 2017 | $1,504 | $21,347 | $5,194 | $16,153 |
| 2016 | $1,900 | $26,611 | $5,551 | $21,060 |
| 2015 | $1,713 | $26,611 | $5,551 | $21,060 |
| 2014 | $1,725 | $26,611 | $5,551 | $21,060 |
| 2013 | $1,993 | $30,240 | $6,307 | $23,933 |
Map
- 4120 Saint Williams Ave
- 1007 Rutledge Ave
- 1002 Winfield Ave
- 1027 Winfield Ave
- 4107 W 8th St
- 718 Trenton Ave
- 1130 Winfield Ave
- 831 Suire Ave
- 1044 Rosemont Ave
- 781 Clanora Dr
- 1114 Winfield Ave
- 700 Trenton Ave
- 4508 Glenway Ave
- 4239 Loubell Ln
- 743 Clanora Dr
- 4267 Eighth St W
- 1226 Rutledge Ave
- 4526 Clearview Ave
- 617 Trenton Ave
- 1239 Rutledge Ave
- 4119 Jamestown St
- 4129 Jamestown St
- 4115 Jamestown St
- 4131 Jamestown St
- 4133 Jamestown St
- 4124 Saint Williams Ave
- 4116 Saint Williams Ave
- 4122 Jamestown St
- 923 Sunset Ave
- 4137 Jamestown St
- 4118 Jamestown St
- 927 Sunset Ave
- 4126 Jamestown St
- 919 Sunset Ave
- 4128 Saint Williams Ave
- 4114 Saint Williams Ave
- 4126 Saint Williams Ave
- 4114 Jamestown St
- 4130 Jamestown St
- 915 Sunset Ave
Ask me questions while you tour the home.