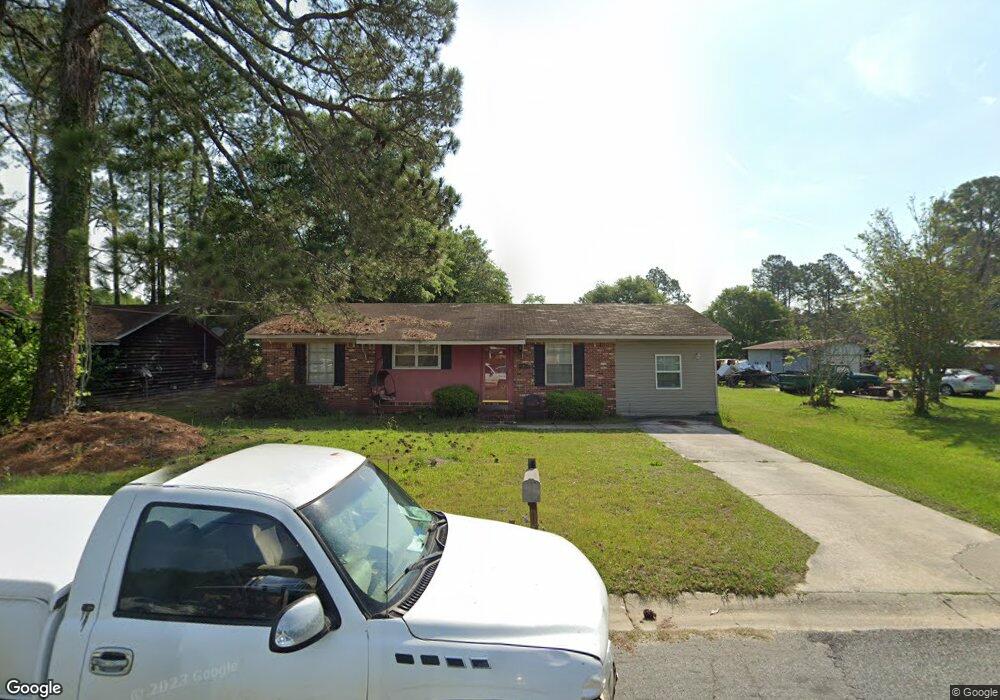
4121 Martin Ave Tifton, GA 31794
Estimated Value: $83,000 - $120,000
3
Beds
2
Baths
1,325
Sq Ft
$78/Sq Ft
Est. Value
About This Home
This home is located at 4121 Martin Ave, Tifton, GA 31794 and is currently estimated at $103,615, approximately $78 per square foot. 4121 Martin Ave is a home located in Tift County with nearby schools including J.T. Reddick School, Matt Wilson Elementary School, and Annie Belle Clark Primary School.
Ownership History
Date
Name
Owned For
Owner Type
Purchase Details
Closed on
Apr 26, 2010
Sold by
Curtis Ray Anthony
Bought by
Hammock Lorenzo
Current Estimated Value
Home Financials for this Owner
Home Financials are based on the most recent Mortgage that was taken out on this home.
Original Mortgage
$60,204
Outstanding Balance
$40,234
Interest Rate
4.99%
Mortgage Type
New Conventional
Estimated Equity
$63,381
Purchase Details
Closed on
May 7, 2009
Sold by
Munford Gertrude H
Bought by
Munford David L
Purchase Details
Closed on
Mar 11, 1983
Sold by
Jenkins Bobby Theron and Jenkins Aomi S
Bought by
Munford David L and Munford Gertrude H
Purchase Details
Closed on
Mar 31, 1979
Sold by
Hines Nathan and Hines Dorothy M
Bought by
Jenkins Bobby Theron and Jenkins Naomi S
Purchase Details
Closed on
Jan 30, 1976
Sold by
Hills Carla A
Bought by
Hines Nathan and Dorothy Mae
Create a Home Valuation Report for This Property
The Home Valuation Report is an in-depth analysis detailing your home's value as well as a comparison with similar homes in the area
Home Values in the Area
Average Home Value in this Area
Purchase History
| Date | Buyer | Sale Price | Title Company |
|---|---|---|---|
| Hammock Lorenzo | $55,000 | -- | |
| Munford David L | -- | -- | |
| Munford David L | -- | -- | |
| Curtis Ray Anthony | -- | -- | |
| Munford David L | $32,000 | -- | |
| Jenkins Bobby Theron | $1,800 | -- | |
| Hines Nathan | -- | -- |
Source: Public Records
Mortgage History
| Date | Status | Borrower | Loan Amount |
|---|---|---|---|
| Open | Hammock Lorenzo | $60,204 |
Source: Public Records
Tax History Compared to Growth
Tax History
| Year | Tax Paid | Tax Assessment Tax Assessment Total Assessment is a certain percentage of the fair market value that is determined by local assessors to be the total taxable value of land and additions on the property. | Land | Improvement |
|---|---|---|---|---|
| 2024 | $630 | $30,895 | $3,200 | $27,695 |
| 2023 | $685 | $22,356 | $2,000 | $20,356 |
| 2022 | $604 | $22,356 | $2,000 | $20,356 |
| 2021 | $608 | $22,356 | $2,000 | $20,356 |
| 2020 | $619 | $22,356 | $2,000 | $20,356 |
| 2019 | $618 | $22,356 | $2,000 | $20,356 |
| 2018 | $617 | $22,356 | $2,000 | $20,356 |
| 2017 | $620 | $22,356 | $2,000 | $20,356 |
| 2016 | $621 | $22,356 | $2,000 | $20,356 |
| 2015 | $621 | $22,356 | $2,000 | $20,356 |
| 2014 | $622 | $22,356 | $2,000 | $20,356 |
| 2013 | -- | $22,356 | $2,000 | $20,356 |
Source: Public Records
Map
Nearby Homes
- 4108 Plaza Dr
- 0 Union Rd
- 4480 Union Rd
- 2901 3rd Ave
- 2906 S Park Ave
- 2729 Central Ave S
- 604 Golden Rd W
- 0 Jordan Rd
- 13 Amoco Rd
- 1911 Park Ave S
- 1910 Park Ave S
- 100 Palmetta Rd
- 603 21st St W
- 64 Palmetta Rd
- 614/620 Old Omega Rd
- 0 Union Industrial Way
- 17 Waters Edge Way
- 18 Tifton Eldorado Rd
- 45 Surrey Cir
- 33 Surrey Cir
- 4123 Martin Ave
- 4119 Martin Ave
- 4125 Martin Ave
- 4117 Martin Ave
- 4118 Emerson O Bynes Ave
- 4120 Martin Ave
- 4124 Martin Ave
- 4116 Martin Ave
- 4127 Martin Ave
- 4116 Emerson O Bynes Ave
- 4115 Martin Ave
- 4124 Emerson O Bynes Ave
- 4126 Martin Ave
- 4129 Martin Ave
- 4114 Martin Ave
- 4113 Martin Ave
- 4128 Martin Ave
- 4119 Emerson O Bynes Ave
- 4112 Martin Ave
- 4121 Emerson O Bynes Ave