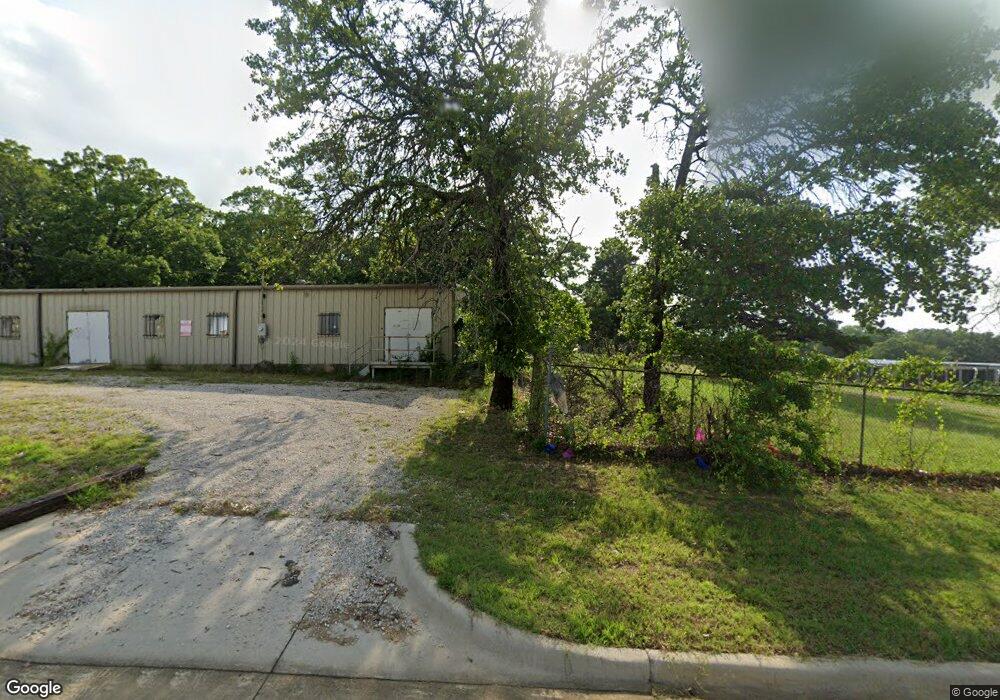
4121 N Parkdale Ln Denison, TX 75020
Estimated Value: $243,000 - $322,301
3
Beds
3
Baths
2,138
Sq Ft
$132/Sq Ft
Est. Value
About This Home
This home is located at 4121 N Parkdale Ln, Denison, TX 75020 and is currently estimated at $282,651, approximately $132 per square foot. 4121 N Parkdale Ln is a home located in Grayson County with nearby schools including Mayes Elementary School, Scott Middle School, and Denison High School.
Ownership History
Date
Name
Owned For
Owner Type
Purchase Details
Closed on
Nov 20, 2024
Sold by
Lovelace Residential Properties Llc
Bought by
Jeje Holdings Llc
Current Estimated Value
Home Financials for this Owner
Home Financials are based on the most recent Mortgage that was taken out on this home.
Original Mortgage
$240,000
Outstanding Balance
$177,183
Interest Rate
5.41%
Mortgage Type
New Conventional
Estimated Equity
$105,468
Purchase Details
Closed on
Feb 28, 2019
Sold by
Lovelace Residential Properties Llc
Bought by
Oneill Daryl
Home Financials for this Owner
Home Financials are based on the most recent Mortgage that was taken out on this home.
Original Mortgage
$145,000
Interest Rate
4.4%
Mortgage Type
New Conventional
Purchase Details
Closed on
Nov 8, 2011
Sold by
Lovelace Mobile Home Rentals Llc
Bought by
Lovelace Residential Properties Llc
Create a Home Valuation Report for This Property
The Home Valuation Report is an in-depth analysis detailing your home's value as well as a comparison with similar homes in the area
Home Values in the Area
Average Home Value in this Area
Purchase History
| Date | Buyer | Sale Price | Title Company |
|---|---|---|---|
| Jeje Holdings Llc | -- | Grayson County Title | |
| Oneill Daryl | -- | Grayson County Title | |
| Lovelace Residential Properties Llc | -- | None Available |
Source: Public Records
Mortgage History
| Date | Status | Borrower | Loan Amount |
|---|---|---|---|
| Open | Jeje Holdings Llc | $240,000 | |
| Previous Owner | Oneill Daryl | $145,000 |
Source: Public Records
Tax History Compared to Growth
Tax History
| Year | Tax Paid | Tax Assessment Tax Assessment Total Assessment is a certain percentage of the fair market value that is determined by local assessors to be the total taxable value of land and additions on the property. | Land | Improvement |
|---|---|---|---|---|
| 2025 | $372 | $23,087 | $23,087 | -- |
| 2024 | $372 | $23,087 | $23,087 | $0 |
| 2023 | $373 | $23,087 | $23,087 | $0 |
| 2022 | $398 | $23,087 | $23,087 | $0 |
| 2021 | $486 | $25,973 | $25,973 | $0 |
| 2020 | $351 | $17,661 | $17,661 | $0 |
| 2019 | $4,376 | $206,596 | $45,931 | $160,665 |
| 2018 | $3,026 | $141,368 | $24,419 | $116,949 |
| 2017 | $2,511 | $116,556 | $7,133 | $109,423 |
| 2016 | $2,364 | $109,733 | $5,998 | $103,735 |
| 2015 | $0 | $76,427 | $5,865 | $70,562 |
| 2014 | -- | $81,556 | $10,882 | $70,674 |
Source: Public Records
Map
Nearby Homes
- 3628 Ansley Blvd
- 3906 Highland Dr
- TBD W Fm 120
- 0000 S Hwy 75
- TBD Valentine Dr
- 3601 Holly St
- 610 Deleon St
- 629 Deleon St
- TBD Deleon St
- 3824 Rose Hill Ct
- Lot 3, 1055 Waters Edge Dr
- Lot 4, 1069 Waters Edge Dr
- Lot 2, 1037 Waters Edge Dr
- Lot 1, 1015 Waters Edge Dr
- Lot 5, 1087 Waters Edge Dr
- 3820 Rose Hill Ct
- 2912 W Elm St
- 3816 Rose Hill Ct
- 3812 Rose Hill Ct
- 3808 Rose Hill Ct
- 4109 N Parkdale Ln
- 4177 N Parkdale Ln
- 203 Parkdale Dr Unit 205
- 4100 N Parkdale Ln Unit 144
- 4100 N Parkdale Ln
- 4100 N Parkdale Ln
- 4156 N Parkdale Ln
- 105 Inwood Rd
- 3815 Pottsboro Rd
- 3815 Pottsboro Rd
- 3909 W Fm 120
- 3831 Pottsboro Rd
- 3817 Pottsboro Rd
- 4218 N Parkdale Ln
- 3811 Pottsboro Rd
- 3906 W Fm 120
- 3830 E Fm 120
- 4234 N Parkdale Ln
- 3819 Hwy 120
- 3807 Pottsboro Rd