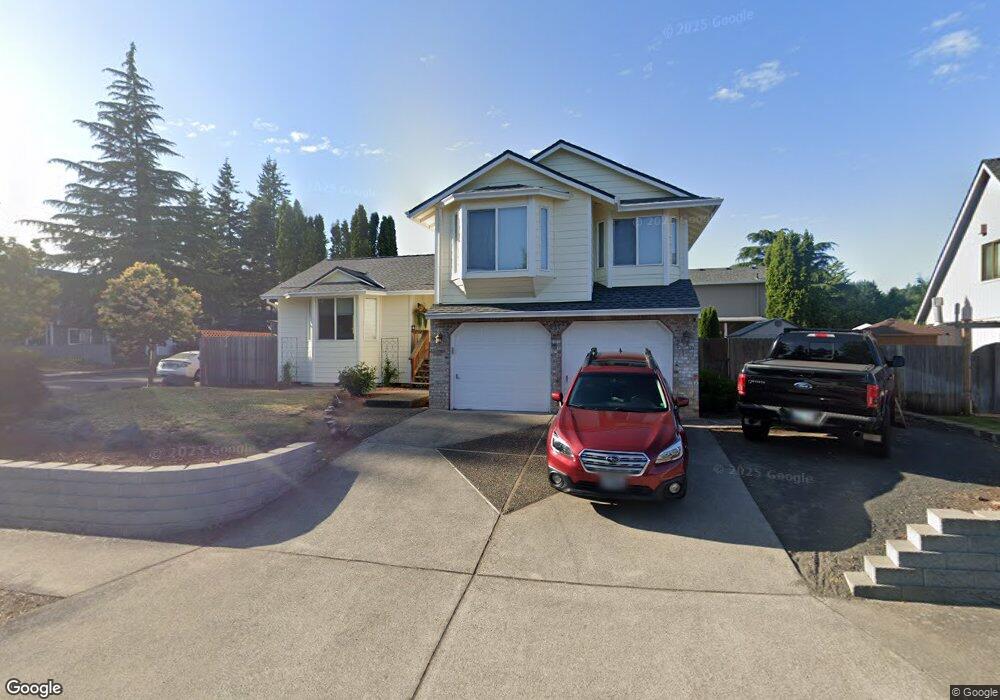
4121 SW 7th St Gresham, OR 97030
Centennial-Gresham NeighborhoodEstimated Value: $466,567 - $511,000
3
Beds
3
Baths
1,541
Sq Ft
$314/Sq Ft
Est. Value
About This Home
This home is located at 4121 SW 7th St, Gresham, OR 97030 and is currently estimated at $483,392, approximately $313 per square foot. 4121 SW 7th St is a home located in Multnomah County with nearby schools including Lynch Meadows Elementary School, Centennial Middle School, and Centennial High School.
Ownership History
Date
Name
Owned For
Owner Type
Purchase Details
Closed on
Jan 13, 2021
Sold by
Galvez Christina M and Galvez Jovil E
Bought by
Galvez Christina M and Galvez Jovil E
Current Estimated Value
Home Financials for this Owner
Home Financials are based on the most recent Mortgage that was taken out on this home.
Original Mortgage
$280,000
Outstanding Balance
$226,520
Interest Rate
2.71%
Mortgage Type
New Conventional
Estimated Equity
$256,872
Purchase Details
Closed on
Apr 20, 2010
Sold by
Bell Christina M
Bought by
Bell Christina M and Galvez Jovil E
Purchase Details
Closed on
Dec 7, 2009
Sold by
King James L
Bought by
Bell Christina M
Home Financials for this Owner
Home Financials are based on the most recent Mortgage that was taken out on this home.
Original Mortgage
$225,342
Interest Rate
4.99%
Mortgage Type
FHA
Create a Home Valuation Report for This Property
The Home Valuation Report is an in-depth analysis detailing your home's value as well as a comparison with similar homes in the area
Home Values in the Area
Average Home Value in this Area
Purchase History
| Date | Buyer | Sale Price | Title Company |
|---|---|---|---|
| Galvez Christina M | -- | Fidelity Natl Ttl Co Of Or | |
| Bell Christina M | -- | Accommodation | |
| Bell Christina M | $229,500 | Chicago Title Ins Co Of Or |
Source: Public Records
Mortgage History
| Date | Status | Borrower | Loan Amount |
|---|---|---|---|
| Open | Galvez Christina M | $280,000 | |
| Closed | Bell Christina M | $225,342 |
Source: Public Records
Tax History
| Year | Tax Paid | Tax Assessment Tax Assessment Total Assessment is a certain percentage of the fair market value that is determined by local assessors to be the total taxable value of land and additions on the property. | Land | Improvement |
|---|---|---|---|---|
| 2025 | $4,833 | $255,190 | -- | -- |
| 2024 | $4,629 | $247,760 | -- | -- |
| 2023 | $4,168 | $240,550 | $0 | $0 |
| 2022 | $4,014 | $233,550 | $0 | $0 |
| 2021 | $4,028 | $226,750 | $0 | $0 |
| 2020 | $3,709 | $220,150 | $0 | $0 |
| 2019 | $3,619 | $213,740 | $0 | $0 |
| 2018 | $3,471 | $207,520 | $0 | $0 |
| 2017 | $3,355 | $201,480 | $0 | $0 |
| 2016 | $3,257 | $195,620 | $0 | $0 |
Source: Public Records
Map
Nearby Homes
- 3749 SW 6th St
- 3756 SW 7th Ct
- 3893 SW 4th St
- 4434 W Powell Blvd
- 4736 W Powell Blvd Unit 129
- 4614 W Powell Blvd Unit 258
- 4606 W Powell Blvd Unit 162
- 4540 SW 11th St Unit E4540
- 4556 SW 11th St
- 17741 SE Marie St
- 0 W Powell Loop
- 3667 SW 2nd St
- 17528 SE Marie St
- 4010 SW 13th Ct
- 4316 SE 174th Ave
- 3412 NW 1st St
- 18023 SE Kelly St
- 4635 SE 174th Ave
- 17118 SE Bush St
- 4015 SE 171st Ave
- 4071 SW 7th St
- 660 SW Linneman Ct
- 691 SW Linneman Ct
- 661 SW Linneman Ct
- 4120 SW 7th St
- 701 SW Linneman Ct
- 661 SW Nancy Ct
- 4051 SW 7th St
- 4080 SW 7th St
- 640 SW Linneman Ct
- 600 SW Linneman Ct
- 731 SW Linneman Ct
- 631 SW Nancy Ct
- 631 SW Linneman Ct
- 601 SW Linneman Ct
- 4060 SW 7th St
- 4121 SW 8th St
- 761 SW Linneman Ct
- 601 SW Nancy Ct
- 4110 SW 5th Dr
Your Personal Tour Guide
Ask me questions while you tour the home.