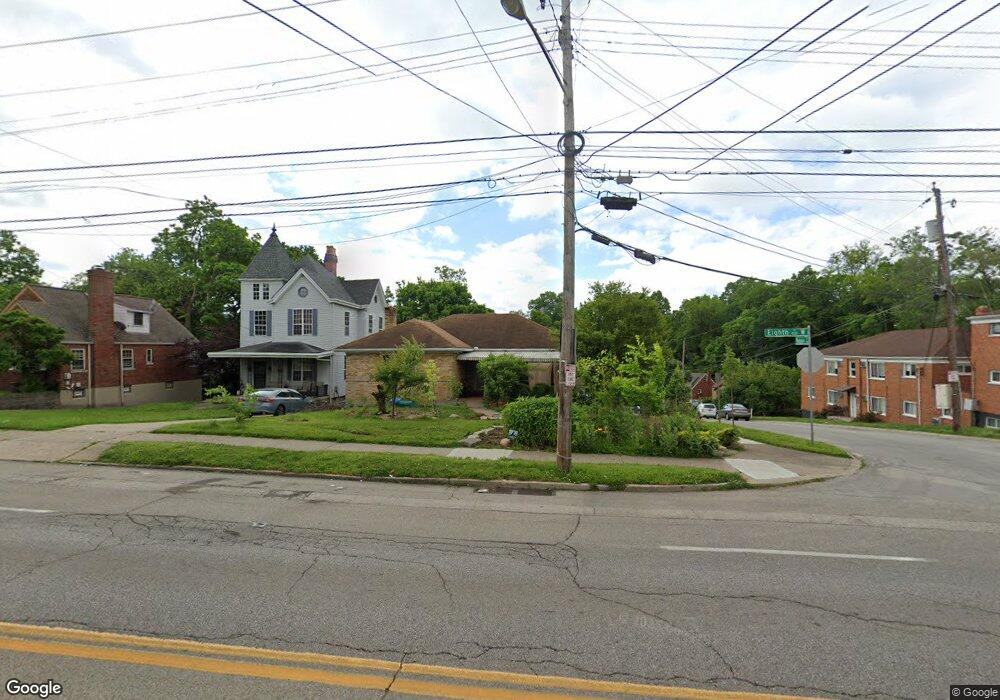
4121 W 8th St Cincinnati, OH 45205
West Price Hill NeighborhoodEstimated Value: $160,000 - $197,934
3
Beds
2
Baths
1,166
Sq Ft
$155/Sq Ft
Est. Value
About This Home
This home is located at 4121 W 8th St, Cincinnati, OH 45205 and is currently estimated at $181,234, approximately $155 per square foot. 4121 W 8th St is a home located in Hamilton County with nearby schools including Carson School, Gilbert A. Dater High School, and Western Hills High School.
Ownership History
Date
Name
Owned For
Owner Type
Purchase Details
Closed on
Oct 11, 2019
Sold by
Ferguson Christopher L and Ferguson Susan L
Bought by
Gunderson Patrick and Hallgarth Grace
Current Estimated Value
Home Financials for this Owner
Home Financials are based on the most recent Mortgage that was taken out on this home.
Original Mortgage
$117,040
Outstanding Balance
$102,002
Interest Rate
3.25%
Mortgage Type
FHA
Estimated Equity
$79,232
Purchase Details
Closed on
Jul 26, 2001
Sold by
Jim Eness T and Jim Gloria
Bought by
Ferguson Christopher L and Ferguson Susan L
Home Financials for this Owner
Home Financials are based on the most recent Mortgage that was taken out on this home.
Original Mortgage
$91,070
Interest Rate
7.15%
Mortgage Type
FHA
Purchase Details
Closed on
Sep 24, 1998
Sold by
Ojeda Martha Teresa
Bought by
Jim Eness T and Jim Gloria
Create a Home Valuation Report for This Property
The Home Valuation Report is an in-depth analysis detailing your home's value as well as a comparison with similar homes in the area
Home Values in the Area
Average Home Value in this Area
Purchase History
| Date | Buyer | Sale Price | Title Company |
|---|---|---|---|
| Gunderson Patrick | $119,200 | None Available | |
| Ferguson Christopher L | $92,500 | Ati Title Agency Of Ohio Inc | |
| Jim Eness T | $80,000 | -- |
Source: Public Records
Mortgage History
| Date | Status | Borrower | Loan Amount |
|---|---|---|---|
| Open | Gunderson Patrick | $117,040 | |
| Previous Owner | Ferguson Christopher L | $91,070 |
Source: Public Records
Tax History Compared to Growth
Tax History
| Year | Tax Paid | Tax Assessment Tax Assessment Total Assessment is a certain percentage of the fair market value that is determined by local assessors to be the total taxable value of land and additions on the property. | Land | Improvement |
|---|---|---|---|---|
| 2024 | $2,981 | $48,784 | $6,381 | $42,403 |
| 2023 | $3,047 | $48,784 | $6,381 | $42,403 |
| 2022 | $2,779 | $41,721 | $6,339 | $35,382 |
| 2021 | $2,860 | $41,721 | $6,339 | $35,382 |
| 2020 | $2,860 | $41,721 | $6,339 | $35,382 |
| 2019 | $1,960 | $25,946 | $5,761 | $20,185 |
| 2018 | $1,963 | $25,946 | $5,761 | $20,185 |
| 2017 | $1,862 | $25,946 | $5,761 | $20,185 |
| 2016 | $1,985 | $27,301 | $6,157 | $21,144 |
| 2015 | $1,793 | $27,301 | $6,157 | $21,144 |
| 2014 | $1,806 | $27,301 | $6,157 | $21,144 |
| 2013 | $2,079 | $31,025 | $6,997 | $24,028 |
Source: Public Records
Map
Nearby Homes
- 700 Trenton Ave
- 617 Trenton Ave
- 4041 W 8th St
- 900 Kreis Ln
- 4247 Eighth St W
- 904 Rosemont Ave
- 1006 Kreis Ln
- 4136 Saint Lawrence Ave
- 4260 Delridge Dr
- 1002 Winfield Ave
- 820 Suire Ave
- 4082 Mardon Place
- 494 Lobob Ct
- 1026 Schiff Ave
- 4330 Schulte Dr
- 4300 Foley Rd
- 4309 Westhaven Ave
- 4226 Skylark Dr
- 4526 Clearview Ave
- 928 Harris Ave
- 4121 Eighth St W
- 4117 Eighth St W
- 4117 W 8th St
- 4117 W 8th St Unit 20
- 4115 W 8th St Unit TWENTY
- 4127 W 8th St
- 4127 Eighth St W
- 4164 Pleasure Dr
- 4129 Eighth St W
- 4111 W 8th St
- 4111 Eighth St W
- 4150 Pleasure Dr
- 4122 W 8th St Unit TWENTY
- 4165 Pleasure Dr
- 4140 Pleasure Dr
- 4118 W 8th St Unit TWENTY
- 4136 Pleasure Dr
- 4126 W 8th St
- 4161 Pleasure Dr
- 4112 Eighth St W