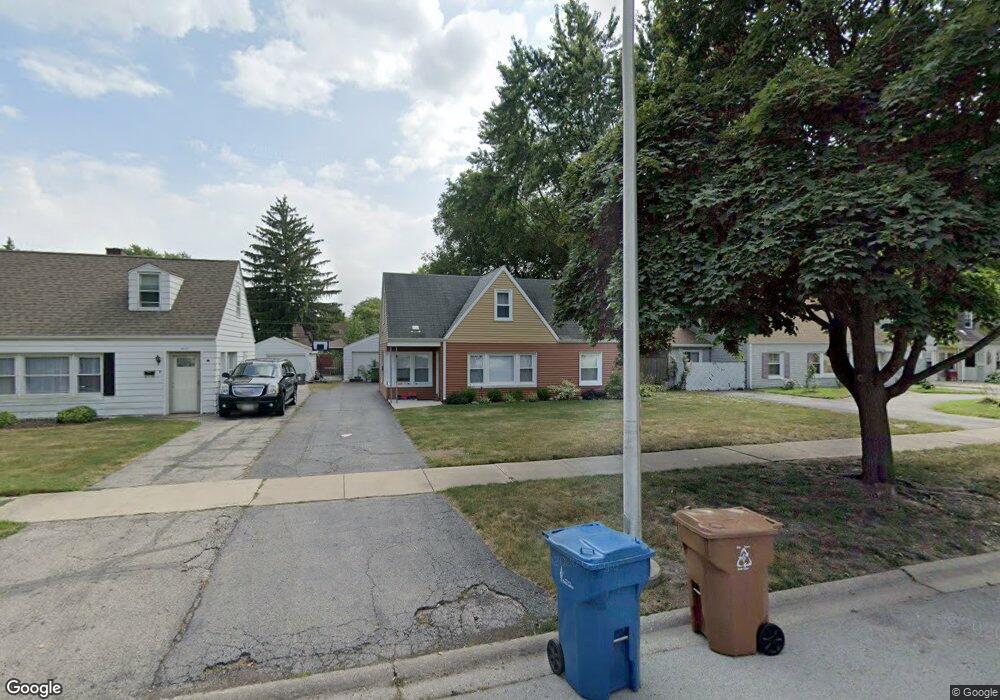
4121 W 99th Place Oak Lawn, IL 60453
Estimated Value: $275,000 - $299,000
4
Beds
1
Bath
1,329
Sq Ft
$220/Sq Ft
Est. Value
About This Home
This home is located at 4121 W 99th Place, Oak Lawn, IL 60453 and is currently estimated at $292,660, approximately $220 per square foot. 4121 W 99th Place is a home located in Cook County with nearby schools including Sward Elementary School, Kolmar Avenue Elementary School, and Hometown Elementary School.
Ownership History
Date
Name
Owned For
Owner Type
Purchase Details
Closed on
Jun 20, 2005
Sold by
Merida Alejandro and Merida Maria G
Bought by
Sumner Marsha A
Current Estimated Value
Home Financials for this Owner
Home Financials are based on the most recent Mortgage that was taken out on this home.
Original Mortgage
$160,000
Outstanding Balance
$82,776
Interest Rate
5.62%
Mortgage Type
Unknown
Estimated Equity
$209,884
Purchase Details
Closed on
Jan 11, 2002
Sold by
Yerkes Michael and Yerkes Darlene M
Bought by
Merida Alejandro and Merida Maria G
Home Financials for this Owner
Home Financials are based on the most recent Mortgage that was taken out on this home.
Original Mortgage
$50,000
Interest Rate
6.92%
Purchase Details
Closed on
Apr 15, 1997
Sold by
Daly George M and Daly Margaret M
Bought by
Yerkes Michael and Mikrut Darlene M
Home Financials for this Owner
Home Financials are based on the most recent Mortgage that was taken out on this home.
Original Mortgage
$113,548
Interest Rate
7.93%
Mortgage Type
FHA
Create a Home Valuation Report for This Property
The Home Valuation Report is an in-depth analysis detailing your home's value as well as a comparison with similar homes in the area
Home Values in the Area
Average Home Value in this Area
Purchase History
| Date | Buyer | Sale Price | Title Company |
|---|---|---|---|
| Sumner Marsha A | $200,000 | Stewart Title Of Illinois | |
| Merida Alejandro | $132,000 | -- | |
| Yerkes Michael | $114,500 | Chicago Title Insurance Co |
Source: Public Records
Mortgage History
| Date | Status | Borrower | Loan Amount |
|---|---|---|---|
| Open | Sumner Marsha A | $160,000 | |
| Previous Owner | Merida Alejandro | $50,000 | |
| Previous Owner | Yerkes Michael | $113,548 |
Source: Public Records
Tax History Compared to Growth
Tax History
| Year | Tax Paid | Tax Assessment Tax Assessment Total Assessment is a certain percentage of the fair market value that is determined by local assessors to be the total taxable value of land and additions on the property. | Land | Improvement |
|---|---|---|---|---|
| 2024 | $6,325 | $20,201 | $5,502 | $14,699 |
| 2023 | $5,266 | $23,000 | $5,502 | $17,498 |
| 2022 | $5,266 | $16,780 | $4,716 | $12,064 |
| 2021 | $5,160 | $16,779 | $4,716 | $12,063 |
| 2020 | $5,195 | $16,779 | $4,716 | $12,063 |
| 2019 | $5,854 | $18,699 | $4,323 | $14,376 |
| 2018 | $5,633 | $18,699 | $4,323 | $14,376 |
| 2017 | $5,727 | $18,699 | $4,323 | $14,376 |
| 2016 | $4,715 | $14,551 | $3,537 | $11,014 |
| 2015 | $4,597 | $14,551 | $3,537 | $11,014 |
| 2014 | $4,552 | $14,551 | $3,537 | $11,014 |
| 2013 | $5,249 | $17,937 | $3,537 | $14,400 |
Source: Public Records
Map
Nearby Homes
- 10001 Kedvale Ave
- 10036 Kedvale Ave
- 4228 W 100th St
- 4116 W 99th St Unit 1A
- 4108 W 99th St Unit C
- 4029 W 99th St
- 10036 S Tripp Ave
- 9831 S Karlov Ave
- 4035 Fitzjames Walk
- 4123 W 98th St Unit C
- 4037 Trafalgar Ln
- 10048 S Pulaski Rd Unit 2B
- 4320 W 99th Place
- 4325 W 99th Place
- 9820 S Pulaski Rd Unit 213
- 9820 S Pulaski Rd Unit 111
- 10100 S Pulaski Rd Unit 1E
- 10008 S Kolin Ave
- 10110 S Pulaski Rd Unit 3W
- 10036 S Kolin Ave
- 4117 W 99th Place
- 4125 W 99th Place
- 4113 W 99th Place
- 4129 W 99th Place
- 4124 W 100th St
- 4128 W 100th St
- 4116 W 100th St
- 4132 W 100th St
- 4109 W 99th Place
- 4133 W 99th Place
- 4112 W 100th St
- 4120 W 99th Place
- 4124 W 99th Place
- 4116 W 99th Place
- 4136 W 100th St
- 4112 W 99th Place
- 4112 W 99th Place Unit D
- 4108 W 100th St
- 4128 W 99th Place
- 4105 W 99th Place