Estimated Value: $409,000 - $635,000
5
Beds
3
Baths
2,620
Sq Ft
$199/Sq Ft
Est. Value
About This Home
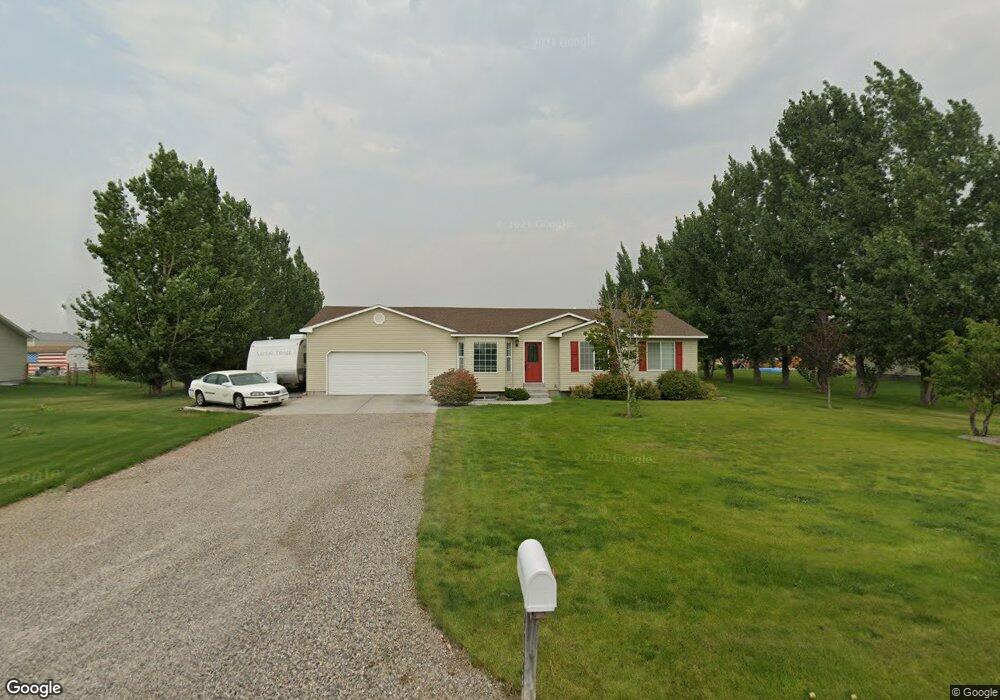
This home is located at 4123 E 82 N, Rigby, ID 83442 and is currently estimated at $520,755, approximately $198 per square foot. 4123 E 82 N is a home located in Jefferson County with nearby schools including South Fork Elementary School, Rigby Middle School, and Rigby High School.
Ownership History
Date
Name
Owned For
Owner Type
Purchase Details
Closed on
Jul 21, 2020
Sold by
Staiger Hugh N and Staiger Shelli
Bought by
Staiger Hugh and Staiger Shelli
Current Estimated Value
Home Financials for this Owner
Home Financials are based on the most recent Mortgage that was taken out on this home.
Original Mortgage
$194,000
Outstanding Balance
$134,388
Interest Rate
3.2%
Mortgage Type
New Conventional
Estimated Equity
$386,367
Purchase Details
Closed on
Feb 10, 2009
Sold by
Staiger Hugh and Staiger Shelli
Bought by
Staiger Hugh N and Staiger Shelli
Home Financials for this Owner
Home Financials are based on the most recent Mortgage that was taken out on this home.
Original Mortgage
$165,700
Interest Rate
4.92%
Mortgage Type
New Conventional
Purchase Details
Closed on
Sep 23, 2005
Sold by
Skandia Properties Of America Inc
Bought by
Staiger Hugh and Staiger Shelli
Create a Home Valuation Report for This Property
The Home Valuation Report is an in-depth analysis detailing your home's value as well as a comparison with similar homes in the area
Purchase History
| Date | Buyer | Sale Price | Title Company |
|---|---|---|---|
| Staiger Hugh | -- | Amerititle Idaho Falls | |
| Staiger Hugh N | -- | -- | |
| Staiger Hugh | -- | -- |
Source: Public Records
Mortgage History
| Date | Status | Borrower | Loan Amount |
|---|---|---|---|
| Open | Staiger Hugh | $194,000 | |
| Closed | Staiger Hugh N | $165,700 |
Source: Public Records
Tax History
| Year | Tax Paid | Tax Assessment Tax Assessment Total Assessment is a certain percentage of the fair market value that is determined by local assessors to be the total taxable value of land and additions on the property. | Land | Improvement |
|---|---|---|---|---|
| 2025 | $930 | $455,781 | $0 | $0 |
| 2024 | $930 | $453,782 | $0 | $0 |
| 2023 | $1,441 | $467,488 | $0 | $0 |
| 2022 | $1,980 | $402,250 | $0 | $0 |
| 2021 | $1,718 | $304,589 | $0 | $0 |
| 2020 | $1,420 | $278,583 | $0 | $0 |
| 2019 | $1,540 | $247,868 | $0 | $0 |
| 2018 | $1,315 | $217,931 | $0 | $0 |
| 2017 | $1,139 | $194,720 | $0 | $0 |
| 2016 | $1,068 | $89,314 | $0 | $0 |
| 2015 | $1,031 | $82,789 | $0 | $0 |
| 2014 | $1,024 | $81,884 | $0 | $0 |
| 2013 | -- | $80,979 | $0 | $0 |
Source: Public Records
Map
Nearby Homes
Your Personal Tour Guide
Ask me questions while you tour the home.