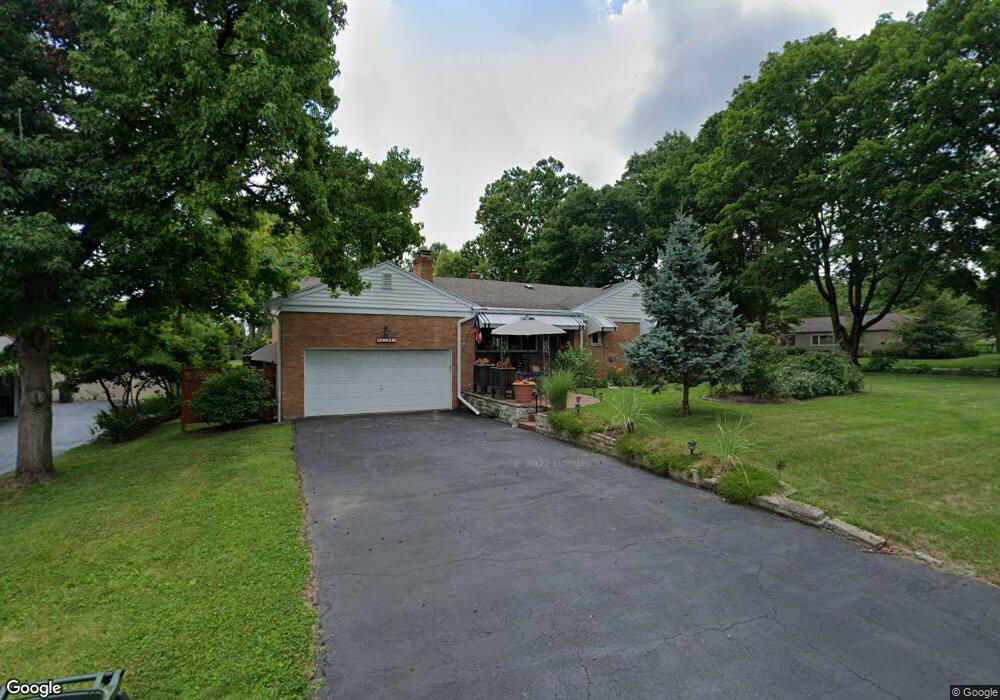
4124 Breckenridge Rd Dayton, OH 45429
Estimated Value: $282,042 - $334,000
3
Beds
2
Baths
1,409
Sq Ft
$215/Sq Ft
Est. Value
About This Home
This home is located at 4124 Breckenridge Rd, Dayton, OH 45429 and is currently estimated at $303,511, approximately $215 per square foot. 4124 Breckenridge Rd is a home located in Montgomery County with nearby schools including Southdale Elementary School, Van Buren Middle School, and Kettering Fairmont High School.
Ownership History
Date
Name
Owned For
Owner Type
Purchase Details
Closed on
Aug 2, 2016
Sold by
Penno Ralph B and Penno Diane L
Bought by
Susner Michael A and Susner Lisa M
Current Estimated Value
Home Financials for this Owner
Home Financials are based on the most recent Mortgage that was taken out on this home.
Original Mortgage
$110,000
Outstanding Balance
$87,767
Interest Rate
3.48%
Mortgage Type
New Conventional
Estimated Equity
$215,744
Purchase Details
Closed on
Sep 8, 2014
Sold by
Penno Ralph B
Bought by
Penno Ralph B and Penno Diane L
Purchase Details
Closed on
Jul 23, 2010
Sold by
Estate Of Charles W Cook Jr
Bought by
Penno Ralph B and The Ralph B Penno Family Trust
Home Financials for this Owner
Home Financials are based on the most recent Mortgage that was taken out on this home.
Original Mortgage
$80,000
Interest Rate
4.81%
Mortgage Type
Future Advance Clause Open End Mortgage
Purchase Details
Closed on
Aug 18, 1994
Sold by
Combs Chester L and Combs Jessie A
Bought by
Cook Charles W
Create a Home Valuation Report for This Property
The Home Valuation Report is an in-depth analysis detailing your home's value as well as a comparison with similar homes in the area
Home Values in the Area
Average Home Value in this Area
Purchase History
| Date | Buyer | Sale Price | Title Company |
|---|---|---|---|
| Susner Michael A | $165,000 | Fidelity Lawyers Title Agenc | |
| Penno Ralph B | -- | Landmark Title Agency S Inc | |
| Penno Ralph B | $120,000 | Attorney | |
| Cook Charles W | -- | -- |
Source: Public Records
Mortgage History
| Date | Status | Borrower | Loan Amount |
|---|---|---|---|
| Open | Susner Michael A | $110,000 | |
| Previous Owner | Penno Ralph B | $80,000 |
Source: Public Records
Tax History Compared to Growth
Tax History
| Year | Tax Paid | Tax Assessment Tax Assessment Total Assessment is a certain percentage of the fair market value that is determined by local assessors to be the total taxable value of land and additions on the property. | Land | Improvement |
|---|---|---|---|---|
| 2024 | $4,628 | $74,670 | $18,110 | $56,560 |
| 2023 | $4,628 | $74,670 | $18,110 | $56,560 |
| 2022 | $4,376 | $55,830 | $13,520 | $42,310 |
| 2021 | $4,047 | $55,830 | $13,520 | $42,310 |
| 2020 | $4,060 | $55,830 | $13,520 | $42,310 |
| 2019 | $3,774 | $45,880 | $12,870 | $33,010 |
| 2018 | $3,794 | $45,880 | $12,870 | $33,010 |
| 2017 | $3,494 | $45,880 | $12,870 | $33,010 |
| 2016 | $3,856 | $46,440 | $12,870 | $33,570 |
| 2015 | $3,594 | $46,440 | $12,870 | $33,570 |
| 2014 | $3,594 | $46,440 | $12,870 | $33,570 |
| 2012 | -- | $44,190 | $12,890 | $31,300 |
Source: Public Records
Map
Nearby Homes
- 298 Marchester Dr
- 4259 Maxlin Rd
- 604 Schuyler Dr
- 115 N Bromfield Rd
- 305 Glenridge Rd
- 791 Willowdale Ave
- 804 Lovetta Dr
- 4808 Judith Dr
- 4816 Judith Dr
- 4824 Far Hills Ave
- 645 Brookfield Rd
- 3993 Applewood Ln
- 3822 Milford Dr
- 617 Laurelann Dr
- 4241 Schrubb Dr
- 101 Enid Ave
- 501 Judith Dr
- 5016 Far Hills Ave
- 959 Kimberly Dr
- 4951 Walnut Walk
- 15 Napoleon Dr
- 4100 Breckenridge Rd
- 0 Breckenridge Trail Unit 618484
- 4125 Breckenridge Rd
- 18 Sherbrooke Dr
- 26 Napoleon Dr
- 20 Napoleon Dr
- 4101 Breckenridge Rd
- 11 Napoleon Dr
- 14 Napoleon Dr
- 4201 Breckenridge Rd
- 10 Sherbrooke Dr
- 109 Napoleon Dr
- 108 Sherbrooke Dr
- 8 Napoleon Dr
- 27 Castle Dr
- 21 Castle Dr
- 33 Sherbrooke Dr
- 108 Napoleon Dr
- 23 Sherbrooke Dr