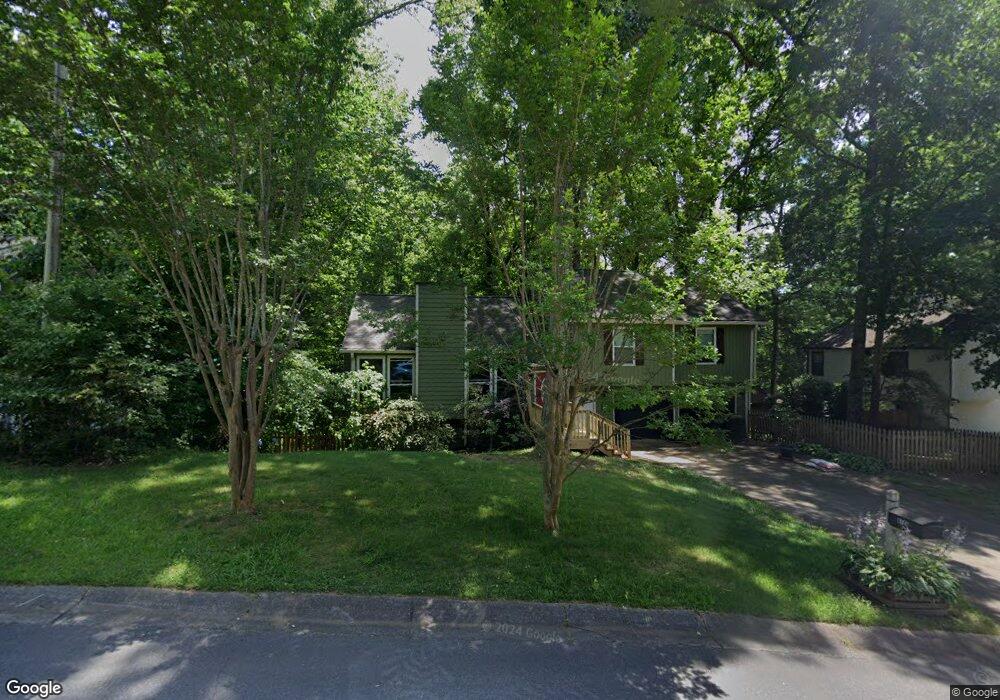
4124 Inola Trail NE Roswell, GA 30075
Sandy Plains NeighborhoodEstimated Value: $411,551 - $449,000
4
Beds
2
Baths
1,539
Sq Ft
$283/Sq Ft
Est. Value
About This Home
This home is located at 4124 Inola Trail NE, Roswell, GA 30075 and is currently estimated at $434,888, approximately $282 per square foot. 4124 Inola Trail NE is a home located in Cobb County with nearby schools including Garrison Mill Elementary School, Mabry Middle School, and Lassiter High School.
Ownership History
Date
Name
Owned For
Owner Type
Purchase Details
Closed on
Dec 22, 2016
Sold by
Cachussie Adrienne
Bought by
Mcmahon Morgan and Mcmahon Michael
Current Estimated Value
Home Financials for this Owner
Home Financials are based on the most recent Mortgage that was taken out on this home.
Original Mortgage
$218,500
Outstanding Balance
$179,156
Interest Rate
4.03%
Mortgage Type
New Conventional
Estimated Equity
$255,732
Purchase Details
Closed on
Oct 12, 2011
Sold by
Rodger Ronnie P
Bought by
Cachussie Adrienne
Home Financials for this Owner
Home Financials are based on the most recent Mortgage that was taken out on this home.
Original Mortgage
$136,451
Interest Rate
4.5%
Mortgage Type
FHA
Purchase Details
Closed on
Jul 26, 1996
Sold by
Geisler Keith L
Bought by
Rodger Ronnie P Joy A
Create a Home Valuation Report for This Property
The Home Valuation Report is an in-depth analysis detailing your home's value as well as a comparison with similar homes in the area
Home Values in the Area
Average Home Value in this Area
Purchase History
| Date | Buyer | Sale Price | Title Company |
|---|---|---|---|
| Mcmahon Morgan | $230,000 | -- | |
| Cachussie Adrienne | $140,000 | -- | |
| Rodger Ronnie P Joy A | $94,900 | -- |
Source: Public Records
Mortgage History
| Date | Status | Borrower | Loan Amount |
|---|---|---|---|
| Open | Mcmahon Morgan | $218,500 | |
| Previous Owner | Cachussie Adrienne | $136,451 | |
| Closed | Rodger Ronnie P Joy A | $0 |
Source: Public Records
Tax History Compared to Growth
Tax History
| Year | Tax Paid | Tax Assessment Tax Assessment Total Assessment is a certain percentage of the fair market value that is determined by local assessors to be the total taxable value of land and additions on the property. | Land | Improvement |
|---|---|---|---|---|
| 2025 | $3,683 | $151,392 | $32,800 | $118,592 |
| 2024 | $3,686 | $151,392 | $32,800 | $118,592 |
| 2023 | $2,899 | $140,088 | $32,800 | $107,288 |
| 2022 | $3,098 | $123,204 | $22,000 | $101,204 |
| 2021 | $2,699 | $105,000 | $22,000 | $83,000 |
| 2020 | $2,404 | $91,528 | $22,000 | $69,528 |
| 2019 | $2,199 | $82,164 | $20,000 | $62,164 |
| 2018 | $2,146 | $79,712 | $20,000 | $59,712 |
| 2017 | $2,292 | $79,712 | $20,000 | $59,712 |
| 2016 | $1,582 | $64,936 | $16,000 | $48,936 |
| 2015 | $1,295 | $52,792 | $12,000 | $40,792 |
| 2014 | $1,306 | $52,792 | $0 | $0 |
Source: Public Records
Map
Nearby Homes
- 4765 Catoosa Trail NE Unit 2
- 4673 Jefferson Township Place
- 4676 Jefferson Township Ln
- 4304 Lindsey Way NE
- 123 Ivey Way
- 153 Witter Way
- 375 Crider Ct
- 4383 Capstone Ct NE
- 359 Crider Ct
- 320 Crider Ct
- 226 Parc View Ln
- 136 Wiley Parc Cir
- 989 Wiley Bridge Rd
- 146 Bellehaven Dr
- 4973 Gunners Pass NE
- 1001 Wiley Bridge Rd
- 109 Wiley Parc Cir
- 4734 Outlook Way NE
- 4126 Inola Trail NE
- 4122 Inola Trail NE
- 4799 Inola Trail
- 4121 Inola Trail NE
- 4949 Keota Run NE
- 4123 Inola Trail NE
- 4119 Inola Trail NE
- 4947 Keota Run NE
- 4125 Inola Trail NE
- 4799 Keota Run NE
- 4939 Keota Run NE
- 4939 Keota Run NE
- 4945 Keota Run NE Unit 2
- 4795 Keota Run NE
- 4928 Keota Run NE
- 4127 Inola Trail NE
- 4941 Keota Run NE
- 4797 Keota Run NE
- 0 Keota Run NE Unit 7479620
- 0 Keota Run NE Unit 7157365