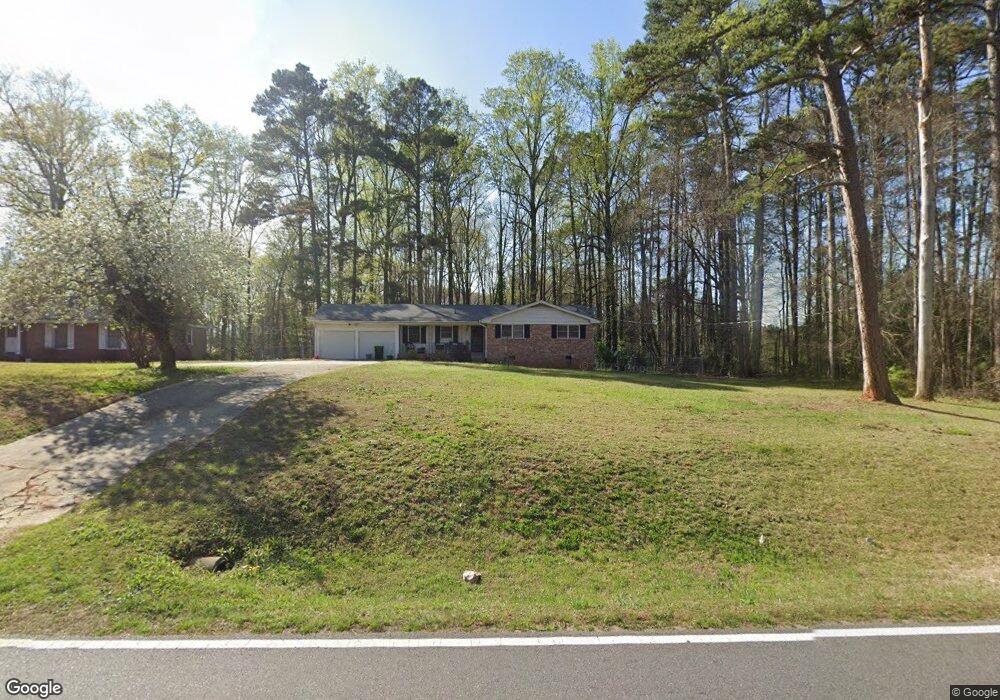
4125 Bouldercrest Rd Ellenwood, GA 30294
Estimated Value: $222,574 - $291,000
3
Beds
2
Baths
1,321
Sq Ft
$189/Sq Ft
Est. Value
About This Home
This home is located at 4125 Bouldercrest Rd, Ellenwood, GA 30294 and is currently estimated at $250,144, approximately $189 per square foot. 4125 Bouldercrest Rd is a home located in Clayton County with nearby schools including Anderson Elementary School, Adamson Middle School, and Morrow High School.
Ownership History
Date
Name
Owned For
Owner Type
Purchase Details
Closed on
Jul 27, 2018
Sold by
Carlton Wilbert
Bought by
Johnson Jones Wanda
Current Estimated Value
Home Financials for this Owner
Home Financials are based on the most recent Mortgage that was taken out on this home.
Original Mortgage
$125,000
Outstanding Balance
$108,783
Interest Rate
4.5%
Mortgage Type
VA
Estimated Equity
$134,068
Purchase Details
Closed on
Nov 18, 2010
Sold by
Carlton Wilbert
Bought by
Carlton Wilbert and Carlton Angela D
Home Financials for this Owner
Home Financials are based on the most recent Mortgage that was taken out on this home.
Original Mortgage
$38,000
Interest Rate
4.2%
Mortgage Type
New Conventional
Purchase Details
Closed on
Aug 4, 2008
Sold by
Goodall Robert R
Bought by
Goodall Jason R and Goodall Catherine
Create a Home Valuation Report for This Property
The Home Valuation Report is an in-depth analysis detailing your home's value as well as a comparison with similar homes in the area
Home Values in the Area
Average Home Value in this Area
Purchase History
| Date | Buyer | Sale Price | Title Company |
|---|---|---|---|
| Johnson Jones Wanda | $125,000 | -- | |
| Carlton Wilbert | -- | -- | |
| Carlton Wilbert | $40,000 | -- | |
| Goodall Jason R | -- | -- |
Source: Public Records
Mortgage History
| Date | Status | Borrower | Loan Amount |
|---|---|---|---|
| Open | Johnson Jones Wanda | $125,000 | |
| Previous Owner | Carlton Wilbert | $38,000 |
Source: Public Records
Tax History Compared to Growth
Tax History
| Year | Tax Paid | Tax Assessment Tax Assessment Total Assessment is a certain percentage of the fair market value that is determined by local assessors to be the total taxable value of land and additions on the property. | Land | Improvement |
|---|---|---|---|---|
| 2024 | $2,885 | $73,960 | $6,600 | $67,360 |
| 2023 | $2,683 | $74,320 | $6,600 | $67,720 |
| 2022 | $2,377 | $60,560 | $6,600 | $53,960 |
| 2021 | $1,948 | $49,320 | $6,600 | $42,720 |
| 2020 | $2,009 | $50,243 | $10,000 | $40,243 |
| 2019 | $1,950 | $48,042 | $10,000 | $38,042 |
| 2018 | $1,057 | $36,048 | $10,000 | $26,048 |
| 2017 | $779 | $29,152 | $10,000 | $19,152 |
| 2016 | $871 | $31,415 | $10,000 | $21,415 |
| 2015 | $870 | $0 | $0 | $0 |
| 2014 | $839 | $31,066 | $10,000 | $21,066 |
Source: Public Records
Map
Nearby Homes
- 4139 Tilson Rd
- 2621 Manor Place
- 1236 Country Pine Dr
- 1202 Palisades Ln
- 1501 Pineview Terrace
- 4137 Donna Ct
- 4283 Northwind Dr
- 3027 Wentworth Ave
- 3311 Rowden Rd
- 3289 Rowden Rd
- 4026 Villagewood Ln
- 4078 Bouldercrest Rd
- 4484 Northridge Trail
- 4161 Ward Lake Trail
- 4153 Ward Lake Trail
- 856 Haydens Ridge
- 2669 Woodfen Dr
- 4130 Windrock Dr
- 4425 Boulder Springs Cove
- 4139 Bouldercrest Rd
- 4148 Bouldercrest Rd
- 4117 Bouldercrest Rd
- 4306 Bouldercrest Rd
- 4168 Bouldercrest Rd
- 4304 Bouldercrest Rd
- 4177 Tilson Rd Unit 2
- 4185 Tilson Rd Unit 2
- 4169 Tilson Rd
- 1203 Country Pine Dr
- 4093 Bouldercrest Rd
- 2616 Manor Place
- 1205 Country Pine Dr
- 4051 Bouldercrest Rd
- 4186 Bouldercrest Rd
- 1200 Country Pine Dr
- 0 Tilson Rd Unit 7564019
- 0 Tilson Rd Unit 8273978
- 0 Tilson Rd Unit 8917697
- 0 Tilson Rd