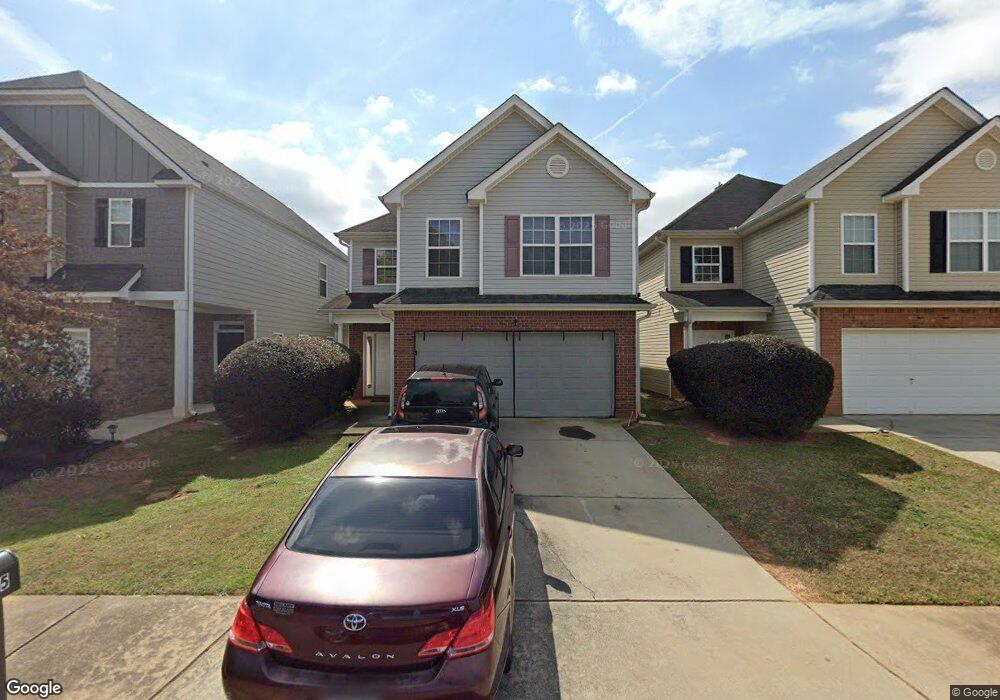
4125 Emmons St McDonough, GA 30253
Estimated Value: $241,000 - $291,000
3
Beds
3
Baths
1,731
Sq Ft
$150/Sq Ft
Est. Value
About This Home
This home is located at 4125 Emmons St, McDonough, GA 30253 and is currently estimated at $259,466, approximately $149 per square foot. 4125 Emmons St is a home located in Henry County with nearby schools including Oakland Elementary School, McDonough Middle School, and McDonough Methodist Academy.
Ownership History
Date
Name
Owned For
Owner Type
Purchase Details
Closed on
May 29, 2020
Sold by
Resicap Cv Borrower Llc
Bought by
Vsp Atlanta Llc
Current Estimated Value
Purchase Details
Closed on
Oct 28, 2019
Sold by
Resicap Fund 1 Llc
Bought by
Resicap Cv Borrower Llc
Home Financials for this Owner
Home Financials are based on the most recent Mortgage that was taken out on this home.
Original Mortgage
$30,000,000
Interest Rate
3.6%
Purchase Details
Closed on
Jun 3, 2019
Sold by
Thomas Markeia
Bought by
Resicap Fund 1 Llc
Purchase Details
Closed on
Dec 19, 2008
Sold by
J & S Properties Of Atlanta Ll
Bought by
Thomas Markeia
Home Financials for this Owner
Home Financials are based on the most recent Mortgage that was taken out on this home.
Original Mortgage
$107,473
Interest Rate
6.1%
Mortgage Type
FHA
Purchase Details
Closed on
Sep 12, 2008
Sold by
Bank Of North Georgia
Bought by
J & S Properties Of Atlanta Ll
Create a Home Valuation Report for This Property
The Home Valuation Report is an in-depth analysis detailing your home's value as well as a comparison with similar homes in the area
Home Values in the Area
Average Home Value in this Area
Purchase History
| Date | Buyer | Sale Price | Title Company |
|---|---|---|---|
| Vsp Atlanta Llc | $140,640 | -- | |
| Resicap Cv Borrower Llc | -- | -- | |
| Resicap Fund 1 Llc | $108,724 | -- | |
| Thomas Markeia | $118,900 | -- | |
| J & S Properties Of Atlanta Ll | $88,100 | -- |
Source: Public Records
Mortgage History
| Date | Status | Borrower | Loan Amount |
|---|---|---|---|
| Previous Owner | Resicap Cv Borrower Llc | $30,000,000 | |
| Previous Owner | Thomas Markeia | $107,473 |
Source: Public Records
Tax History Compared to Growth
Tax History
| Year | Tax Paid | Tax Assessment Tax Assessment Total Assessment is a certain percentage of the fair market value that is determined by local assessors to be the total taxable value of land and additions on the property. | Land | Improvement |
|---|---|---|---|---|
| 2025 | $3,901 | $104,520 | $12,000 | $92,520 |
| 2024 | $3,901 | $107,600 | $10,400 | $97,200 |
| 2023 | $4,224 | $112,640 | $10,400 | $102,240 |
| 2022 | $3,301 | $85,920 | $10,400 | $75,520 |
| 2021 | $2,219 | $56,280 | $8,442 | $47,838 |
| 2020 | $1,733 | $43,520 | $8,791 | $34,729 |
| 2019 | $624 | $45,320 | $9,600 | $35,720 |
| 2018 | $572 | $41,920 | $6,000 | $35,920 |
| 2016 | $400 | $30,600 | $5,000 | $25,600 |
| 2015 | $331 | $25,120 | $3,440 | $21,680 |
| 2014 | $245 | $21,160 | $4,000 | $17,160 |
Source: Public Records
Map
Nearby Homes
- 1705 Labonte Pkwy
- 3045 Hendrick Dr
- 1945 Labonte Pkwy Unit 42
- 1330 Labonte Pkwy
- 1120 Labonte Pkwy
- 272 Long Dr
- 243 Long Dr
- 212 Long Dr
- 1138 McConaughy Ct
- 1028 McConaughy Ct Unit 14
- 816 Royal Red Ct
- 43 George W Lemon Dr
- 43 George Lemon Dr
- 30 Lemon Place
- 90 King Blvd
- 6041 Creekerton Blvd
- 133 Fairview Rd
- 6033 Creekerton Blvd
- 61 Cherry St
- 80 Wise Rd
- 4135 Emmons St
- 4115 Emmons St Unit 72
- 4115 Emmons St
- 4025 Emmons St Unit 66
- 4025 Emmons St
- 4015 Emmons St Unit 67
- 4015 Emmons St
- 4035 Emmons St Unit 65
- 4035 Emmons St
- 4005 Emmons St Unit 68
- 4005 Emmons St
- 4045 Emmons St Unit 64
- 4045 Emmons St
- 4140 Emmons St Unit 78
- 4140 Emmons St
- 1610 Labonte Pkwy
- 1610 Labonte Pkwy Unit 1610
- 1610 Labonte Pkwy Unit 52
- 1610 Labonte Pkwy Unit Lot81
- 1610 Labonte Pkwy