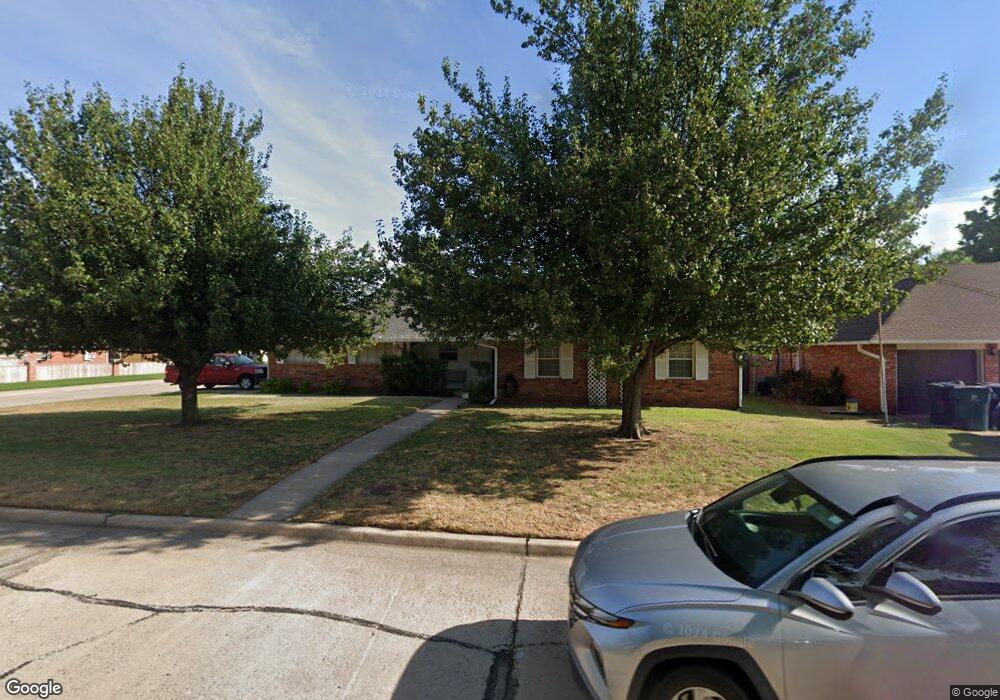
4125 NW 48th St Oklahoma City, OK 73112
Arbor Grove NeighborhoodEstimated Value: $227,416 - $247,000
3
Beds
2
Baths
1,649
Sq Ft
$144/Sq Ft
Est. Value
About This Home
This home is located at 4125 NW 48th St, Oklahoma City, OK 73112 and is currently estimated at $237,104, approximately $143 per square foot. 4125 NW 48th St is a home located in Oklahoma County with nearby schools including Arbor Grove Elementary School, James L. Capps Middle School, and Putnam City High School.
Ownership History
Date
Name
Owned For
Owner Type
Purchase Details
Closed on
Dec 15, 2014
Sold by
Selby Shellita O and The Evelyn I Miner Revocable T
Bought by
Mcmahon Kimberly A and Mcmahon David L
Current Estimated Value
Home Financials for this Owner
Home Financials are based on the most recent Mortgage that was taken out on this home.
Original Mortgage
$132,063
Outstanding Balance
$100,521
Interest Rate
3.75%
Mortgage Type
FHA
Estimated Equity
$136,583
Purchase Details
Closed on
Mar 10, 2010
Sold by
Miner Evelyn
Bought by
Miner Evelyn I and The Evelyn I Miner Revocable T
Purchase Details
Closed on
Nov 13, 2009
Sold by
Miner Evelyn
Bought by
Miner Evelyn I and The Evelyn I Miner Revocable T
Purchase Details
Closed on
Oct 24, 1997
Sold by
Boston Jerry W and Boston Haley M
Bought by
Miner James E and Miner Evelyn
Create a Home Valuation Report for This Property
The Home Valuation Report is an in-depth analysis detailing your home's value as well as a comparison with similar homes in the area
Home Values in the Area
Average Home Value in this Area
Purchase History
| Date | Buyer | Sale Price | Title Company |
|---|---|---|---|
| Mcmahon Kimberly A | $134,500 | None Available | |
| Miner Evelyn I | -- | None Available | |
| Miner Evelyn I | -- | None Available | |
| Miner James E | $96,000 | -- |
Source: Public Records
Mortgage History
| Date | Status | Borrower | Loan Amount |
|---|---|---|---|
| Open | Mcmahon Kimberly A | $132,063 |
Source: Public Records
Tax History Compared to Growth
Tax History
| Year | Tax Paid | Tax Assessment Tax Assessment Total Assessment is a certain percentage of the fair market value that is determined by local assessors to be the total taxable value of land and additions on the property. | Land | Improvement |
|---|---|---|---|---|
| 2024 | $2,031 | $18,190 | $3,763 | $14,427 |
| 2023 | $2,031 | $17,661 | $2,622 | $15,039 |
| 2022 | $1,992 | $17,145 | $2,858 | $14,287 |
| 2021 | $1,912 | $16,646 | $3,173 | $13,473 |
| 2020 | $1,845 | $16,162 | $3,231 | $12,931 |
| 2019 | $1,761 | $15,692 | $3,197 | $12,495 |
| 2018 | $1,709 | $15,235 | $0 | $0 |
| 2017 | $1,702 | $15,153 | $3,267 | $11,886 |
| 2016 | $1,646 | $14,711 | $3,242 | $11,469 |
| 2015 | $1,735 | $14,283 | $3,110 | $11,173 |
| 2014 | $1,480 | $12,663 | $2,802 | $9,861 |
Source: Public Records
Map
Nearby Homes
- 4105 NW 50th St
- 4212 NW 45th St
- 4129 NW 51st St
- 4324 NW 47th St
- 4208 NW 43rd St
- 4317 NW 45th St
- 4400 NW 46th St
- 4325 NW 44th St
- 3901 NW 44th St
- 4329 NW 44th St
- 5209 N Roff Ave
- 5521 N Shawnee Ave
- 3820 NW 51st Place
- 4406 NW 54th St
- 4124 NW 56th St
- 4333 NW 55th St
- 3917 NW 55th St
- 4312 NW 56th Terrace
- 4117 NW 56th Place
- 4600 NW 46th St
- 4119 NW 48th St
- 4904 N Brunson St
- 4201 NW 48th St
- 4113 NW 48th St
- 4908 N Brunson St
- 4124 NW 48th St
- 4118 NW 48th St
- 4907 N Brunson St
- 4130 NW 48th St
- 4207 NW 48th St
- 4112 NW 48th St
- 4913 N Brunson St
- 4107 NW 48th St
- 4912 N Brunson St
- 4200 NW 48th St
- 4108 NW 48th St
- 4908 N Vermont Ave
- 4213 NW 48th St
- 4917 N Brunson St
- 4206 NW 48th St