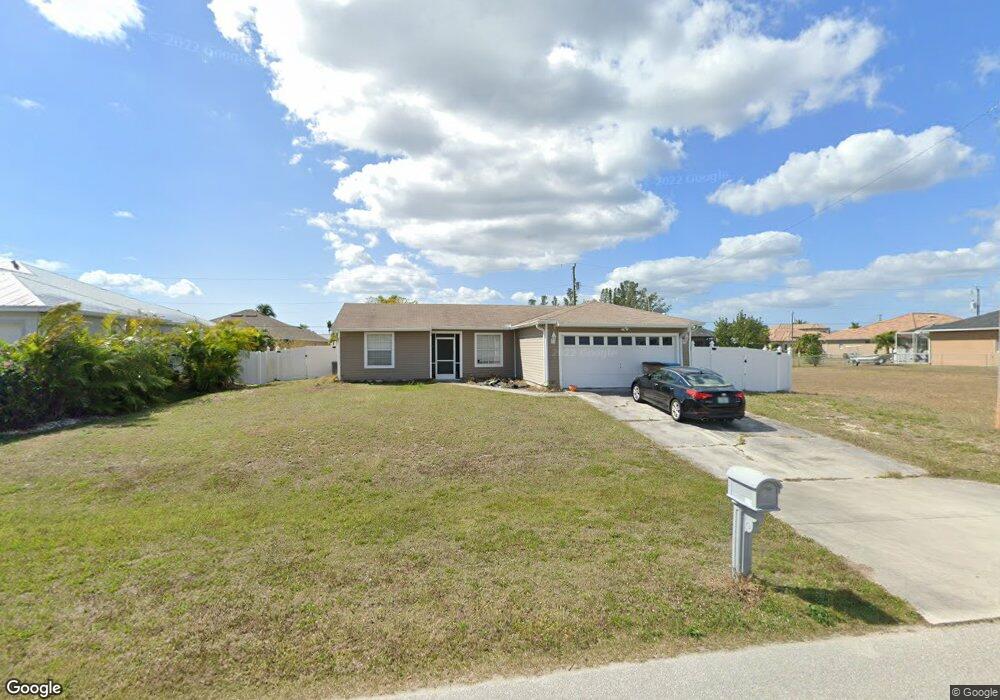
4126 SW 19th Ave Cape Coral, FL 33914
Pelican NeighborhoodEstimated Value: $252,187 - $329,000
3
Beds
2
Baths
1,262
Sq Ft
$233/Sq Ft
Est. Value
About This Home
This home is located at 4126 SW 19th Ave, Cape Coral, FL 33914 and is currently estimated at $293,797, approximately $232 per square foot. 4126 SW 19th Ave is a home located in Lee County with nearby schools including Cape Elementary School, Caloosa Elementary School, and Tropic Isles Elementary School.
Ownership History
Date
Name
Owned For
Owner Type
Purchase Details
Closed on
Apr 25, 2013
Sold by
Federal Home Loan Mortgage Corporation
Bought by
Russell Gayle A and Gayle A Russell Revocable Trust
Current Estimated Value
Purchase Details
Closed on
Apr 9, 2013
Sold by
Provident Funding Associates Lp
Bought by
Federal Home Loan Mortgage Corporation
Purchase Details
Closed on
Nov 28, 2012
Sold by
Stack Kay Y
Bought by
Provident Funding Associates Lp
Purchase Details
Closed on
Sep 19, 2005
Sold by
Seitz Joshua J and Seitz Shannon M
Bought by
Stack Kay Y
Home Financials for this Owner
Home Financials are based on the most recent Mortgage that was taken out on this home.
Original Mortgage
$225,000
Interest Rate
7.12%
Mortgage Type
Unknown
Purchase Details
Closed on
Nov 17, 2000
Sold by
Gurnery Robert E
Bought by
Seitz Joshua J and Seitz Shannon M
Home Financials for this Owner
Home Financials are based on the most recent Mortgage that was taken out on this home.
Original Mortgage
$72,200
Interest Rate
7.87%
Create a Home Valuation Report for This Property
The Home Valuation Report is an in-depth analysis detailing your home's value as well as a comparison with similar homes in the area
Home Values in the Area
Average Home Value in this Area
Purchase History
| Date | Buyer | Sale Price | Title Company |
|---|---|---|---|
| Russell Gayle A | $60,000 | Stewart Title Company | |
| Federal Home Loan Mortgage Corporation | -- | Attorney | |
| Provident Funding Associates Lp | -- | None Available | |
| Stack Kay Y | $225,000 | Security Title & Abstract Ll | |
| Seitz Joshua J | $36,100 | -- | |
| Gurney Robert E | $76,000 | -- |
Source: Public Records
Mortgage History
| Date | Status | Borrower | Loan Amount |
|---|---|---|---|
| Previous Owner | Stack Kay Y | $225,000 | |
| Previous Owner | Gurney Robert E | $72,200 |
Source: Public Records
Tax History Compared to Growth
Tax History
| Year | Tax Paid | Tax Assessment Tax Assessment Total Assessment is a certain percentage of the fair market value that is determined by local assessors to be the total taxable value of land and additions on the property. | Land | Improvement |
|---|---|---|---|---|
| 2025 | $4,116 | $191,943 | $88,825 | $94,305 |
| 2024 | $3,940 | $193,889 | -- | -- |
| 2023 | $3,940 | $176,263 | $0 | $0 |
| 2022 | $3,427 | $160,239 | $0 | $0 |
| 2021 | $3,080 | $146,266 | $47,807 | $98,459 |
| 2020 | $2,922 | $132,429 | $36,000 | $96,429 |
| 2019 | $2,750 | $124,359 | $36,000 | $88,359 |
| 2018 | $2,799 | $125,969 | $31,500 | $94,469 |
| 2017 | $2,648 | $117,903 | $24,000 | $93,903 |
| 2016 | $2,351 | $104,238 | $25,544 | $78,694 |
| 2015 | $2,152 | $88,806 | $21,603 | $67,203 |
| 2014 | -- | $84,201 | $13,609 | $70,592 |
| 2013 | -- | $79,507 | $10,500 | $69,007 |
Source: Public Records
Map
Nearby Homes
- 4122 SW 19th Ave
- 1810 SW 42nd St
- 4235 SW 20th Ave
- 1804 Beach Pkwy W
- 4311 SW 20th Ave
- 1910 SW 40th St
- 1712 Beach Pkwy W Unit 70
- 2809 SW 17th Place
- 2019 SW 43rd Terrace
- 4218 SW 17th Ave
- 1708 Beach Pkwy W
- 4328 SW 20th Place
- 4343 SW 20th Ave
- 3917 SW 20th Place
- 4715 Agualinda Blvd
- 3920 SW 20th Place
- 3934 SW 17th Ave
- 1823 SW 39th St Unit 70
- 3809 SW 16th Place
- 4130 SW 21st Place
- 4130 SW 19th Ave
- 4127 SW 19th Place
- 4123 SW 19th Place
- 4118 SW 19th Ave
- 4131 SW 19th Place Unit 7
- 4208 SW 19th Ave
- 4135 SW 19th Place
- 1834 SW 42nd St
- 4212 SW 19th Ave
- 4228 SW 19th Place
- 4139 SW 19th Place
- 4128 SW 19th Place
- 4124 SW 19th Place
- 4132 SW 19th Place
- 1830 SW 42nd St
- 4120 SW 19th Place
- 4108 SW 19th Ave
- 4216 SW 19th Ave
- 4136 SW 19th Place Unit 38
- 4136 SW 19th Place