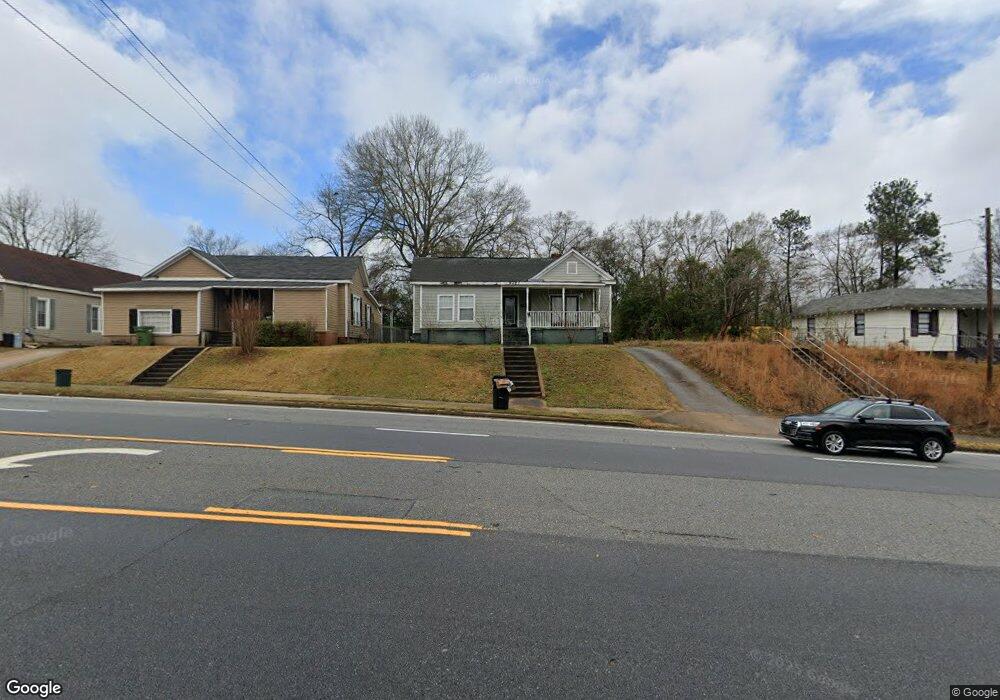
4127 2nd Ave Columbus, GA 31904
North Highlands NeighborhoodEstimated Value: $77,000 - $129,000
2
Beds
2
Baths
1,748
Sq Ft
$56/Sq Ft
Est. Value
About This Home
This home is located at 4127 2nd Ave, Columbus, GA 31904 and is currently estimated at $97,883, approximately $55 per square foot. 4127 2nd Ave is a home located in Muscogee County with nearby schools including Fox Elementary School, Double Churches Middle School, and Jordan Vocational High School.
Ownership History
Date
Name
Owned For
Owner Type
Purchase Details
Closed on
Jul 23, 2025
Sold by
Goodman Carol Jean
Bought by
Wills Jack Leonard and Wills Joseph Daren
Current Estimated Value
Purchase Details
Closed on
Nov 18, 2013
Sold by
Mitchell Samuel
Bought by
Goodman Carol J
Home Financials for this Owner
Home Financials are based on the most recent Mortgage that was taken out on this home.
Original Mortgage
$54,400
Interest Rate
4.31%
Mortgage Type
New Conventional
Purchase Details
Closed on
Sep 19, 2011
Sold by
Coast 2 Coast Lending Grp
Bought by
Mitchell Samuel
Purchase Details
Closed on
Jan 27, 2011
Sold by
Fannie Mae
Bought by
Coast 2 Coast Lending Group Llc
Purchase Details
Closed on
Sep 7, 2010
Sold by
Chase Home Finance Llc
Bought by
Federal National Mortgage Association
Create a Home Valuation Report for This Property
The Home Valuation Report is an in-depth analysis detailing your home's value as well as a comparison with similar homes in the area
Home Values in the Area
Average Home Value in this Area
Purchase History
| Date | Buyer | Sale Price | Title Company |
|---|---|---|---|
| Wills Jack Leonard | -- | None Listed On Document | |
| Wills Jack Leonard | -- | None Listed On Document | |
| Goodman Carol J | $68,000 | -- | |
| Mitchell Samuel | $12,000 | -- | |
| Coast 2 Coast Lending Group Llc | $14,000 | None Available | |
| Federal National Mortgage Association | -- | None Available | |
| Chase Home Finance Llc | $50,574 | None Available |
Source: Public Records
Mortgage History
| Date | Status | Borrower | Loan Amount |
|---|---|---|---|
| Previous Owner | Goodman Carol J | $54,400 |
Source: Public Records
Tax History Compared to Growth
Tax History
| Year | Tax Paid | Tax Assessment Tax Assessment Total Assessment is a certain percentage of the fair market value that is determined by local assessors to be the total taxable value of land and additions on the property. | Land | Improvement |
|---|---|---|---|---|
| 2025 | $969 | $24,756 | $7,528 | $17,228 |
| 2024 | $969 | $24,756 | $7,528 | $17,228 |
| 2023 | $975 | $24,756 | $7,528 | $17,228 |
| 2022 | $850 | $20,816 | $7,528 | $13,288 |
| 2021 | $850 | $20,816 | $7,528 | $13,288 |
| 2020 | $850 | $20,816 | $7,528 | $13,288 |
| 2019 | $853 | $20,816 | $7,528 | $13,288 |
| 2018 | $853 | $20,816 | $7,528 | $13,288 |
| 2017 | $856 | $20,816 | $7,528 | $13,288 |
| 2016 | $421 | $10,211 | $1,381 | $8,830 |
| 2015 | $422 | $10,211 | $1,381 | $8,830 |
| 2014 | $422 | $10,211 | $1,381 | $8,830 |
| 2013 | -- | $15,697 | $1,381 | $14,316 |
Source: Public Records
Map
Nearby Homes