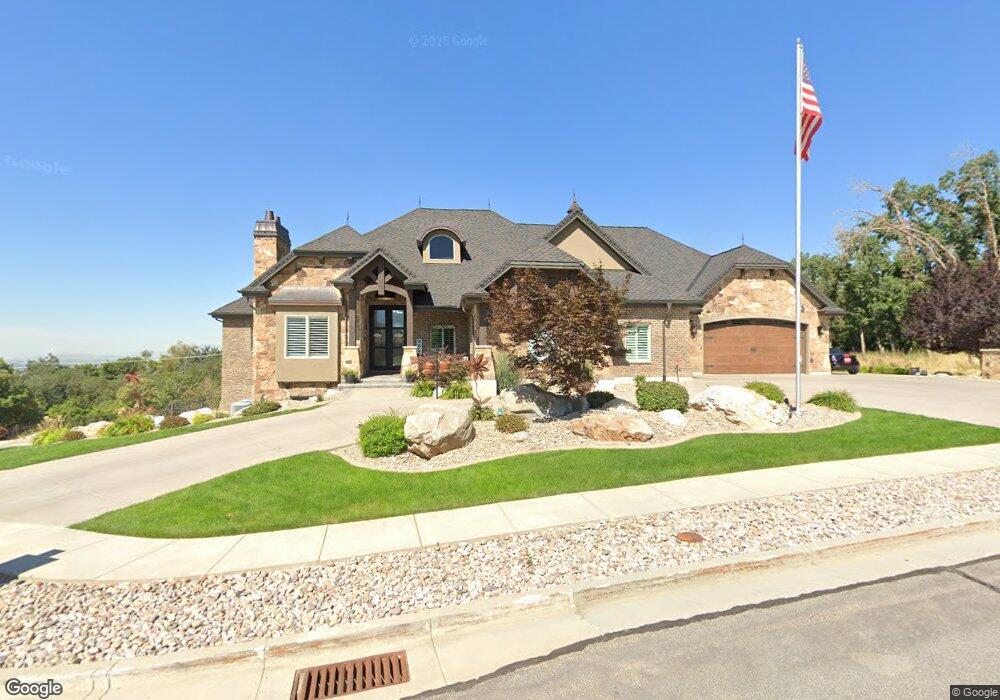
4127 Alder Creek Dr Unit 25 Pleasant View, UT 84414
Estimated Value: $1,370,000 - $1,808,000
3
Beds
5
Baths
2,998
Sq Ft
$529/Sq Ft
Est. Value
About This Home
This home is located at 4127 Alder Creek Dr Unit 25, Pleasant View, UT 84414 and is currently estimated at $1,587,042, approximately $529 per square foot. 4127 Alder Creek Dr Unit 25 is a home located in Weber County with nearby schools including Lomond View School, Orion Junior High School, and Weber High School.
Ownership History
Date
Name
Owned For
Owner Type
Purchase Details
Closed on
Dec 28, 2014
Sold by
Rmj Family Lp
Bought by
The Alan And Cheryl Pringle Revocable Tr and Pringle Cheryl
Current Estimated Value
Purchase Details
Closed on
Jun 10, 2014
Sold by
Alder Creek Subdivision Lc
Bought by
Rmj Family Lp
Purchase Details
Closed on
Mar 3, 2014
Sold by
Pringle Alan S and Pringle Cheryl
Bought by
Pringle Alan S and Pringle Cheryl
Home Financials for this Owner
Home Financials are based on the most recent Mortgage that was taken out on this home.
Original Mortgage
$500,000
Interest Rate
4.38%
Mortgage Type
Purchase Money Mortgage
Purchase Details
Closed on
Jul 31, 2013
Sold by
Pringle Alan S and Pringle Cheryl L
Bought by
Pringle Alan S and Pringle Cheryl
Purchase Details
Closed on
Jul 17, 2012
Sold by
Alder Creek Subdivision Lc
Bought by
Pringle Alan S and Pringle Cheryl L
Create a Home Valuation Report for This Property
The Home Valuation Report is an in-depth analysis detailing your home's value as well as a comparison with similar homes in the area
Home Values in the Area
Average Home Value in this Area
Purchase History
| Date | Buyer | Sale Price | Title Company |
|---|---|---|---|
| The Alan And Cheryl Pringle Revocable Tr | -- | Mountain View Title Ogden | |
| Rmj Family Lp | -- | Mountain View Title | |
| Pringle Alan S | -- | None Available | |
| Pringle Alan S | -- | None Available | |
| Pringle Alan S | -- | Mountain View Title Ogden |
Source: Public Records
Mortgage History
| Date | Status | Borrower | Loan Amount |
|---|---|---|---|
| Previous Owner | Pringle Alan S | $500,000 |
Source: Public Records
Tax History Compared to Growth
Tax History
| Year | Tax Paid | Tax Assessment Tax Assessment Total Assessment is a certain percentage of the fair market value that is determined by local assessors to be the total taxable value of land and additions on the property. | Land | Improvement |
|---|---|---|---|---|
| 2025 | $9,974 | $1,551,053 | $347,002 | $1,204,051 |
| 2024 | $5,289 | $392,892 | $206,443 | $186,449 |
| 2023 | $13,089 | $1,143,037 | $195,202 | $947,835 |
| 2022 | $11,922 | $1,049,400 | $184,065 | $865,335 |
| 2021 | $10,362 | $1,531,000 | $246,750 | $1,284,250 |
| 2020 | $9,106 | $1,235,000 | $212,850 | $1,022,150 |
| 2019 | $9,321 | $1,211,000 | $200,850 | $1,010,150 |
| 2018 | $8,651 | $1,070,039 | $200,850 | $869,189 |
| 2017 | $8,479 | $990,000 | $194,850 | $795,150 |
| 2016 | $7,536 | $480,385 | $112,200 | $368,185 |
| 2015 | $6,262 | $448,388 | $112,200 | $336,188 |
| 2014 | -- | $0 | $0 | $0 |
Source: Public Records
Map
Nearby Homes
- 4127 Alder Creek Dr
- 4145 Alder Creek Dr
- 4123 Alder Creek Dr
- 4145 Alder Creek Dr Unit 26
- 4123 Alder Creek Dr Unit 24
- 194 W 4125 N
- 325 W 4100 N
- 4152 Alder Creek Dr Unit 41
- 4180 Alder Creek Dr
- 4130 Alder Creek Dr Unit 42
- 4121 Alder Creek Dr
- 4130 Alder Creek Dr
- 4177 Alder Creek Dr
- 4157 N 900 W
- 4016 N 800 W
- 4206 N 900 W
- 796 W 4125 N Unit 14
- 796 W 4125 N
- 828 W 4050 N
- 4177 N 900 W