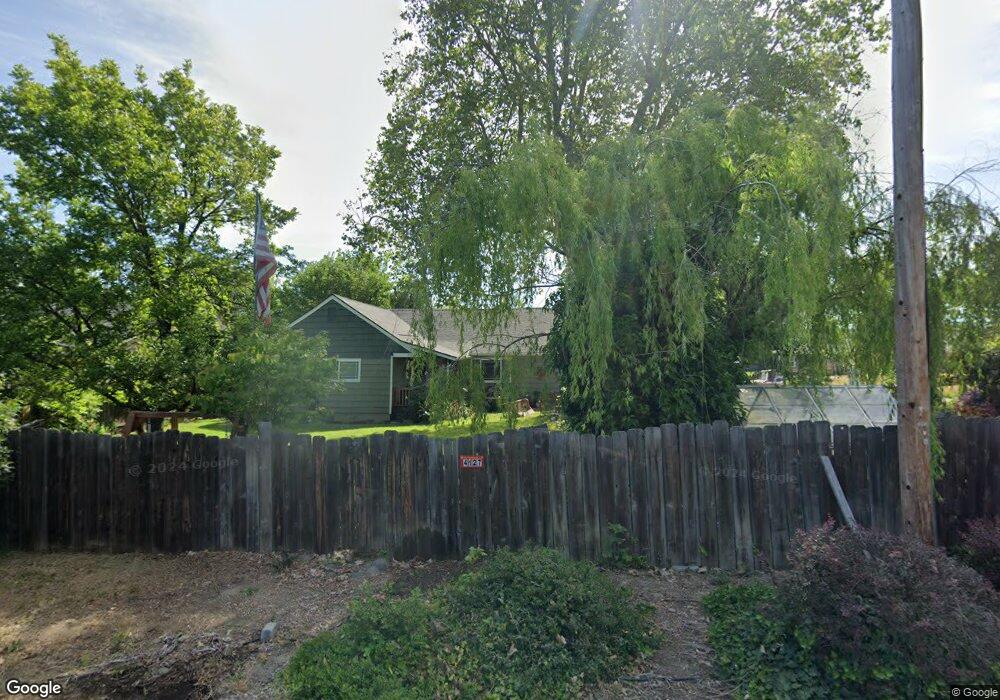
4127 Colver Rd Phoenix, OR 97535
Estimated Value: $415,381 - $503,000
4
Beds
2
Baths
1,824
Sq Ft
$247/Sq Ft
Est. Value
About This Home
This home is located at 4127 Colver Rd, Phoenix, OR 97535 and is currently estimated at $450,845, approximately $247 per square foot. 4127 Colver Rd is a home located in Jackson County with nearby schools including Phoenix Elementary School, Talent Middle School, and Phoenix High School.
Ownership History
Date
Name
Owned For
Owner Type
Purchase Details
Closed on
Dec 3, 2020
Sold by
Kamrath Torsten and Williams Catherine L
Bought by
Kamrath Torsten and Kamrath Catherine Louise
Current Estimated Value
Home Financials for this Owner
Home Financials are based on the most recent Mortgage that was taken out on this home.
Original Mortgage
$224,000
Outstanding Balance
$199,782
Interest Rate
2.8%
Mortgage Type
New Conventional
Estimated Equity
$251,063
Purchase Details
Closed on
Jun 14, 2012
Sold by
Gritsch Colver Llc
Bought by
Kamrath Torsten and Williams Catherine L
Home Financials for this Owner
Home Financials are based on the most recent Mortgage that was taken out on this home.
Original Mortgage
$175,000
Interest Rate
3.79%
Mortgage Type
Seller Take Back
Purchase Details
Closed on
Sep 29, 2003
Sold by
Gritsch John M and Gritsch Helen E
Bought by
Gritsch Colver Llc
Purchase Details
Closed on
Aug 5, 2003
Sold by
Gritsch Co Llc
Bought by
Gritsch John M and Gritsch Helen E
Create a Home Valuation Report for This Property
The Home Valuation Report is an in-depth analysis detailing your home's value as well as a comparison with similar homes in the area
Home Values in the Area
Average Home Value in this Area
Purchase History
| Date | Buyer | Sale Price | Title Company |
|---|---|---|---|
| Kamrath Torsten | -- | First American Title | |
| Kamrath Torsten | $175,000 | Ticor Title | |
| Gritsch Colver Llc | -- | None Available | |
| Gritsch John M | -- | -- |
Source: Public Records
Mortgage History
| Date | Status | Borrower | Loan Amount |
|---|---|---|---|
| Open | Kamrath Torsten | $224,000 | |
| Closed | Kamrath Torsten | $175,000 |
Source: Public Records
Tax History Compared to Growth
Tax History
| Year | Tax Paid | Tax Assessment Tax Assessment Total Assessment is a certain percentage of the fair market value that is determined by local assessors to be the total taxable value of land and additions on the property. | Land | Improvement |
|---|---|---|---|---|
| 2025 | $3,473 | $216,580 | $85,600 | $130,980 |
| 2024 | $3,473 | $210,280 | $83,100 | $127,180 |
| 2023 | $3,364 | $204,160 | $80,680 | $123,480 |
| 2022 | $3,275 | $204,160 | $80,680 | $123,480 |
| 2021 | $3,197 | $198,220 | $78,320 | $119,900 |
| 2020 | $3,096 | $192,450 | $76,040 | $116,410 |
| 2019 | $3,014 | $181,410 | $71,680 | $109,730 |
| 2018 | $2,925 | $176,130 | $69,600 | $106,530 |
| 2017 | $2,764 | $176,130 | $69,600 | $106,530 |
| 2016 | $2,689 | $166,020 | $65,610 | $100,410 |
| 2015 | $2,584 | $166,020 | $52,640 | $113,380 |
| 2014 | $2,487 | $156,500 | $49,620 | $106,880 |
Source: Public Records
Map
Nearby Homes
- 504 Elm St
- 817 Amerman Dr
- 454 Elm St
- 4624 S Pacific Hwy Unit 26
- 4624 S Pacific Hwy Unit 61
- 158 Sharon Dr
- 1620 Pacific Ln
- 201 S Rose St
- 404 Oak St
- 105 W 1st St
- 309 W 1st St
- 4601 S Pacific Hwy Unit 3
- 4601 S Pacific Hwy Unit 29
- 4601 S Pacific Hwy Unit 18
- 4729 S Pacific Hwy Unit 14
- 4729 S Pacific Hwy Unit 39
- 4729 S Pacific Hwy Unit 16
- 133 S Main St
- 605 W 4th St
- 2011 Camp Baker Rd Unit n/a
- 4123 Colver Rd
- 105 Samuel Ln
- 100 Samuel Ln
- 104 Samuel Ln
- 109 Samuel Ln
- 108 Samuel Ln
- 113 Samuel Ln
- 112 Samuel Ln
- 117 Samuel Ln
- 116 Samuel Ln
- 4126 Colver Rd
- 4219 Colver Rd Unit Cottage
- 4219 Colver Rd
- 121 Samuel Ln
- 125 Samuel Ln
- 124 Samuel Ln
- 4090 Colver Rd
- 4188 Colver Rd
- 4263 Colver Rd
- 4005 Colver Rd