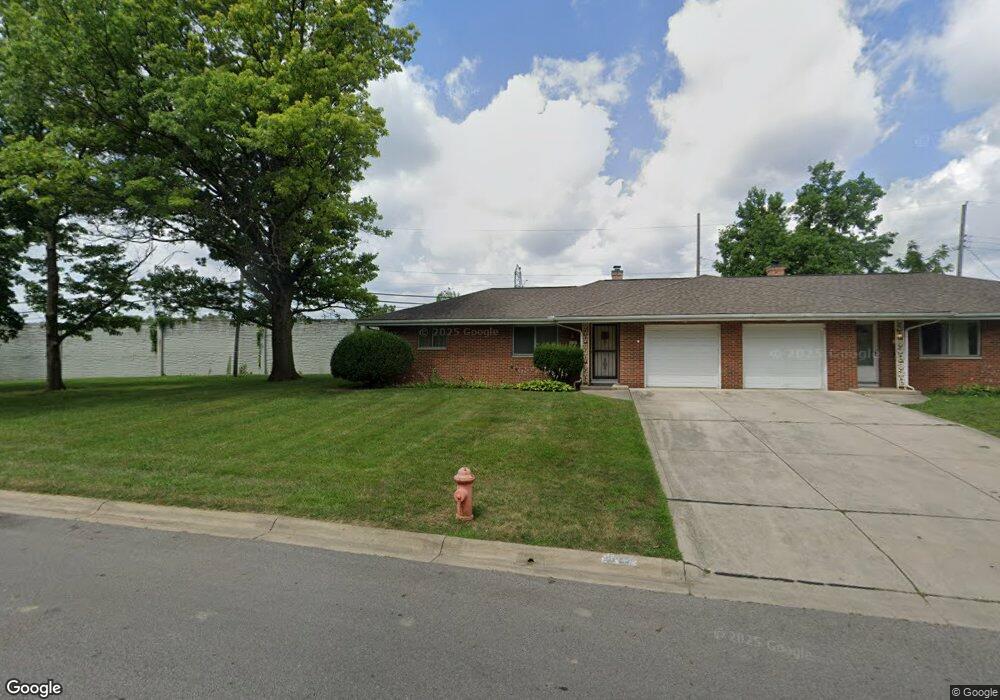
4127 Glenmawr Ave Unit 129 Columbus, OH 43224
Maize-Morse NeighborhoodEstimated Value: $279,000 - $353,000
2
Beds
1
Bath
2,100
Sq Ft
$149/Sq Ft
Est. Value
About This Home
This home is located at 4127 Glenmawr Ave Unit 129, Columbus, OH 43224 and is currently estimated at $313,319, approximately $149 per square foot. 4127 Glenmawr Ave Unit 129 is a home located in Franklin County with nearby schools including Maize Road Elementary School, Medina Middle School, and Mifflin High School.
Ownership History
Date
Name
Owned For
Owner Type
Purchase Details
Closed on
May 20, 2008
Sold by
Halsey Pamela S and Wilson Rodney P
Bought by
Galbraith Daniel W
Current Estimated Value
Purchase Details
Closed on
May 16, 2003
Sold by
Grey Catharine L
Bought by
Halsey Pamela S
Home Financials for this Owner
Home Financials are based on the most recent Mortgage that was taken out on this home.
Original Mortgage
$102,150
Interest Rate
5.9%
Mortgage Type
Purchase Money Mortgage
Purchase Details
Closed on
Jun 19, 1999
Sold by
Gray Catherine L and Grey Edward J
Bought by
Grey Catherine L and Grey Edward J
Purchase Details
Closed on
Feb 1, 1991
Bought by
Grey Edward J
Create a Home Valuation Report for This Property
The Home Valuation Report is an in-depth analysis detailing your home's value as well as a comparison with similar homes in the area
Home Values in the Area
Average Home Value in this Area
Purchase History
| Date | Buyer | Sale Price | Title Company |
|---|---|---|---|
| Galbraith Daniel W | $155,000 | Principle | |
| Halsey Pamela S | $137,000 | Expedient Title Ltd | |
| Grey Catherine L | -- | -- | |
| Grey Edward J | -- | -- |
Source: Public Records
Mortgage History
| Date | Status | Borrower | Loan Amount |
|---|---|---|---|
| Previous Owner | Halsey Pamela S | $102,150 |
Source: Public Records
Tax History Compared to Growth
Tax History
| Year | Tax Paid | Tax Assessment Tax Assessment Total Assessment is a certain percentage of the fair market value that is determined by local assessors to be the total taxable value of land and additions on the property. | Land | Improvement |
|---|---|---|---|---|
| 2024 | $4,305 | $93,940 | $22,750 | $71,190 |
| 2023 | $4,251 | $93,940 | $22,750 | $71,190 |
| 2022 | $2,863 | $53,870 | $8,750 | $45,120 |
| 2021 | $2,868 | $53,870 | $8,750 | $45,120 |
| 2020 | $2,872 | $53,870 | $8,750 | $45,120 |
| 2019 | $2,679 | $43,090 | $7,000 | $36,090 |
| 2018 | $1,337 | $43,090 | $7,000 | $36,090 |
| 2017 | $2,901 | $43,090 | $7,000 | $36,090 |
| 2016 | $3,122 | $45,960 | $8,230 | $37,730 |
| 2015 | $1,421 | $45,960 | $8,230 | $37,730 |
| 2014 | $2,850 | $45,960 | $8,230 | $37,730 |
| 2013 | $1,480 | $48,370 | $8,645 | $39,725 |
Source: Public Records
Map
Nearby Homes
- 814 Meadowview Dr
- 4000 Indianola Ave
- 4193 Eastlea Dr
- 685 Yaronia Dr N
- 995 Overbrook Service Dr
- 3965 Wynding Dr
- 4299 Colerain Ave
- 4508 Glenmawr Ave
- 924 Northridge Rd
- 3724 Eisenhower Rd
- 541 Northridge Rd
- 527 Northridge Rd
- 780 Moon Rd
- 1191 Bryson Rd
- 4441 Wetmore Rd E
- 458 Northridge Rd
- 1206 Bryson Rd
- 475 Garden Rd
- 1004 Marland Dr N
- 452 Chatham Rd
- 4129 Glenmawr Ave Unit 4129
- 4124 Glenmawr Ave
- 4145 Glenmawr Ave
- 4142 Glenmawr Ave
- 856 E Cooke Rd
- 4157 Glenmawr Ave Unit 159
- 4152 Glenmawr Ave
- 4159 Glenmawr Ave
- 807 Marland Dr S
- 4169 Glenmawr Ave Unit 171
- 874 E Cooke Rd
- 819 Marland Dr S
- 4179 Glenmawr Ave Unit 181
- 833 Marland Dr S
- 855 E Cooke Rd
- 845 Marland Dr S
- 4191-4193 Glenmawr Ave
- 4191 Glenmawr Ave Unit 193
- 900 E Cooke Rd
- 4194 Glenmawr Ave