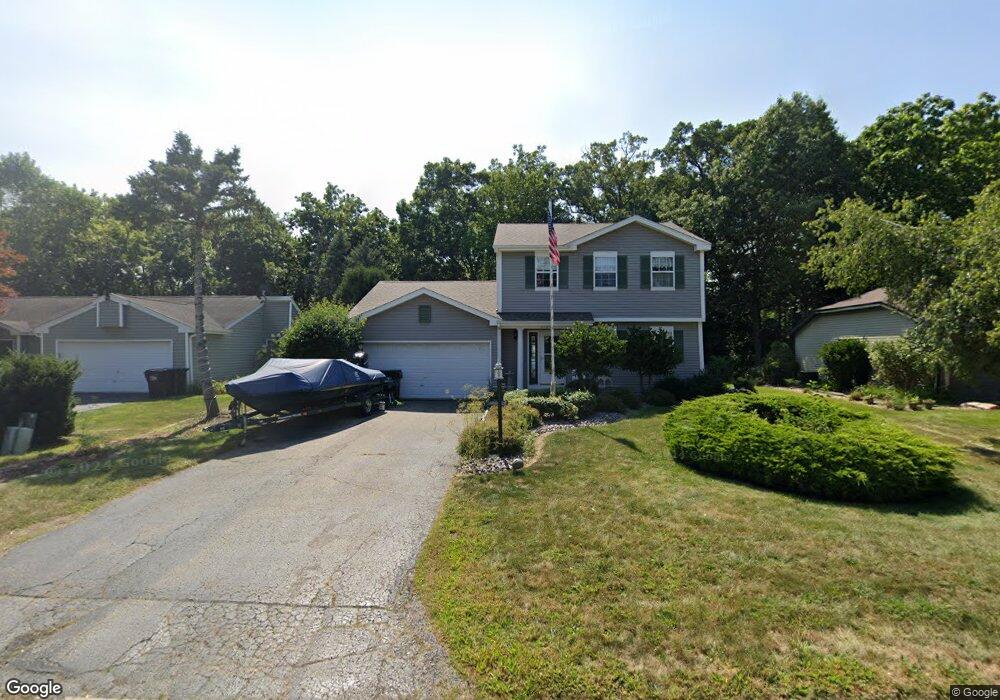
4127 Hale Ln Unit 11 Island Lake, IL 60042
West Island Lake NeighborhoodEstimated Value: $336,000 - $345,000
3
Beds
5
Baths
1,685
Sq Ft
$203/Sq Ft
Est. Value
About This Home
This home is located at 4127 Hale Ln Unit 11, Island Lake, IL 60042 and is currently estimated at $341,246, approximately $202 per square foot. 4127 Hale Ln Unit 11 is a home located in McHenry County with nearby schools including Cotton Creek School, Matthews Middle School, and Wauconda High School.
Ownership History
Date
Name
Owned For
Owner Type
Purchase Details
Closed on
Mar 20, 2000
Sold by
Sharp Louis M and Sharp Molly M
Bought by
Czepieiuk Peter and Vehrs Julie
Current Estimated Value
Home Financials for this Owner
Home Financials are based on the most recent Mortgage that was taken out on this home.
Original Mortgage
$142,800
Outstanding Balance
$48,884
Interest Rate
8.43%
Estimated Equity
$292,362
Purchase Details
Closed on
Nov 29, 1995
Sold by
Poczekaj Donald R
Bought by
Sharp Louis M and Howell Molly M
Home Financials for this Owner
Home Financials are based on the most recent Mortgage that was taken out on this home.
Original Mortgage
$92,200
Interest Rate
7.43%
Purchase Details
Closed on
Aug 17, 1994
Sold by
Pickus Edward L
Bought by
Poczekaj Donald R
Home Financials for this Owner
Home Financials are based on the most recent Mortgage that was taken out on this home.
Original Mortgage
$110,150
Interest Rate
5.37%
Create a Home Valuation Report for This Property
The Home Valuation Report is an in-depth analysis detailing your home's value as well as a comparison with similar homes in the area
Home Values in the Area
Average Home Value in this Area
Purchase History
| Date | Buyer | Sale Price | Title Company |
|---|---|---|---|
| Czepieiuk Peter | $174,500 | Plm Title Company | |
| Sharp Louis M | $152,000 | Attorneys Natl Title Network | |
| Poczekaj Donald R | $138,000 | -- |
Source: Public Records
Mortgage History
| Date | Status | Borrower | Loan Amount |
|---|---|---|---|
| Open | Czepieiuk Peter | $142,800 | |
| Previous Owner | Sharp Louis M | $92,200 | |
| Previous Owner | Poczekaj Donald R | $110,150 |
Source: Public Records
Tax History Compared to Growth
Tax History
| Year | Tax Paid | Tax Assessment Tax Assessment Total Assessment is a certain percentage of the fair market value that is determined by local assessors to be the total taxable value of land and additions on the property. | Land | Improvement |
|---|---|---|---|---|
| 2024 | $7,330 | $100,894 | $23,492 | $77,402 |
| 2023 | $7,024 | $90,480 | $21,067 | $69,413 |
| 2022 | $7,159 | $77,861 | $16,188 | $61,673 |
| 2021 | $6,922 | $72,999 | $15,177 | $57,822 |
| 2020 | $6,558 | $70,811 | $14,722 | $56,089 |
| 2019 | $6,473 | $67,324 | $13,997 | $53,327 |
| 2018 | $6,224 | $64,418 | $13,148 | $51,270 |
| 2017 | $6,040 | $61,715 | $12,596 | $49,119 |
| 2016 | $5,886 | $58,883 | $12,018 | $46,865 |
| 2013 | -- | $46,270 | $11,438 | $34,832 |
Source: Public Records
Map
Nearby Homes
- 4125 Hale Ln Unit 10
- 4024 Newport Dr
- 4400 Riverside Dr
- 833 Dartmouth Dr Unit 7
- 4504 Vista Dr
- 3625 Newport Dr
- 3816 Riverside Dr
- Lot 9 Burton Trail
- 1040 Wimbledon Dr Unit 7
- 3525 Southport Dr
- 1302 Autumn Ridge Ct
- 811 Newport Dr
- 1125 Revere Ln
- 0 Southport Dr
- 3618 Burton Trail
- 6 Lots Porten Rd
- 3807 Mccabe Ave
- 1721 Il Route 176
- 1909 Louise St
- NEC Route 176 & Westridge Dr
- 4129 Hale Ln Unit 11
- 4123 Hale Ln
- 4203 Hale Ln
- 4128 Hale Ln
- 4126 Hale Ln Unit 11
- 4119 Hale Ln
- 4200 Hale Ln Unit 11
- 4205 Hale Ln Unit 11
- 4124 Hale Ln
- 4115 Hale Ln
- 4208 Hale Ln Unit 11
- 4207 Hale Ln
- 4116 Hale Ln
- 4209 Hale Ln Unit 11
- 4111 Hale Ln
- 4210 Hale Ln
- 1003 Victoria Dr Unit 10
- 4404 Giant Oak Dr
- 1001 Victoria Dr Unit 11
- 4109 Hale Ln