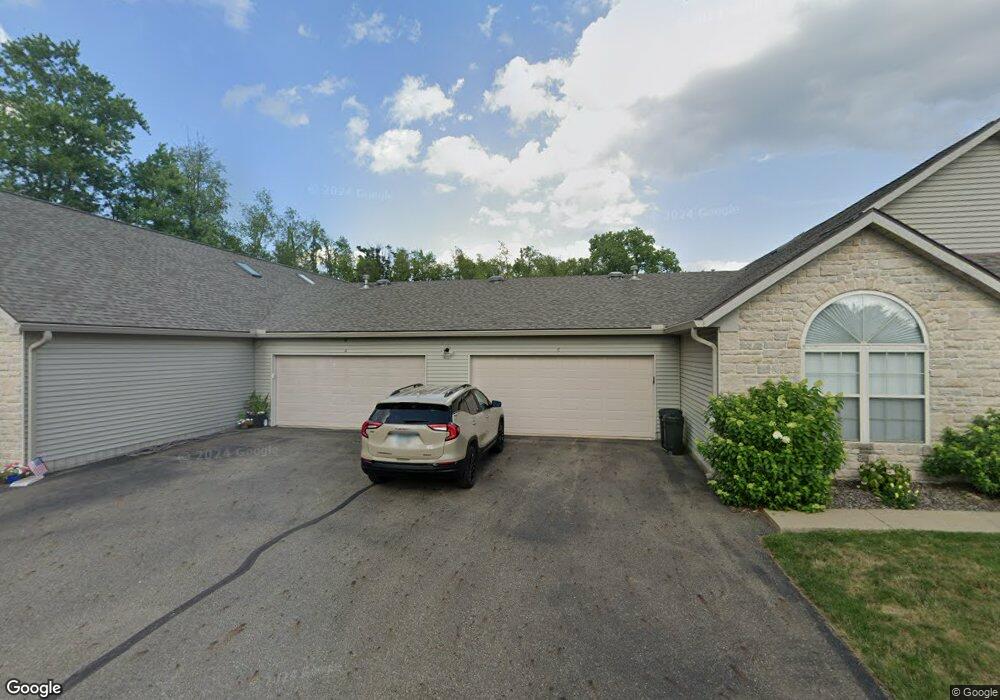
4127 Tannybrooke Ln NW Unit 7B Canton, OH 44718
Avondale NeighborhoodEstimated Value: $239,606 - $250,000
2
Beds
2
Baths
1,586
Sq Ft
$155/Sq Ft
Est. Value
About This Home
This home is located at 4127 Tannybrooke Ln NW Unit 7B, Canton, OH 44718 and is currently estimated at $245,652, approximately $154 per square foot. 4127 Tannybrooke Ln NW Unit 7B is a home located in Stark County with nearby schools including Robert A. Taft Elementary School, Glenwood Intermediate School, and GlenOak High School.
Ownership History
Date
Name
Owned For
Owner Type
Purchase Details
Closed on
Apr 3, 2024
Sold by
Schmidt Lauri A and Grant Catherine M
Bought by
Hoberg William L
Current Estimated Value
Home Financials for this Owner
Home Financials are based on the most recent Mortgage that was taken out on this home.
Original Mortgage
$75,900
Outstanding Balance
$71,386
Interest Rate
6.29%
Mortgage Type
New Conventional
Estimated Equity
$174,266
Purchase Details
Closed on
Sep 30, 2015
Sold by
Ford Doris A
Bought by
Schmidt Edward G and Schmidt Virginia L
Purchase Details
Closed on
Aug 16, 2000
Sold by
W D Operating Inc
Bought by
Ford Doris A
Home Financials for this Owner
Home Financials are based on the most recent Mortgage that was taken out on this home.
Original Mortgage
$35,900
Interest Rate
8.26%
Create a Home Valuation Report for This Property
The Home Valuation Report is an in-depth analysis detailing your home's value as well as a comparison with similar homes in the area
Home Values in the Area
Average Home Value in this Area
Purchase History
| Date | Buyer | Sale Price | Title Company |
|---|---|---|---|
| Hoberg William L | $234,900 | None Listed On Document | |
| Schmidt Edward G | $147,000 | Attorney | |
| Ford Doris A | $139,900 | -- |
Source: Public Records
Mortgage History
| Date | Status | Borrower | Loan Amount |
|---|---|---|---|
| Open | Hoberg William L | $75,900 | |
| Previous Owner | Ford Doris A | $35,900 |
Source: Public Records
Tax History Compared to Growth
Tax History
| Year | Tax Paid | Tax Assessment Tax Assessment Total Assessment is a certain percentage of the fair market value that is determined by local assessors to be the total taxable value of land and additions on the property. | Land | Improvement |
|---|---|---|---|---|
| 2025 | -- | $71,300 | $14,770 | $56,530 |
| 2024 | -- | $71,300 | $14,770 | $56,530 |
| 2023 | $2,063 | $53,800 | $9,450 | $44,350 |
| 2022 | $2,075 | $53,800 | $9,450 | $44,350 |
| 2021 | $2,087 | $53,800 | $9,450 | $44,350 |
| 2020 | $2,129 | $50,050 | $9,100 | $40,950 |
| 2019 | $2,117 | $50,050 | $9,100 | $40,950 |
| 2018 | $2,089 | $50,050 | $9,100 | $40,950 |
| 2017 | $1,972 | $44,520 | $9,800 | $34,720 |
| 2016 | $1,977 | $44,520 | $9,800 | $34,720 |
| 2015 | $1,912 | $44,520 | $9,800 | $34,720 |
| 2014 | $1,682 | $39,520 | $9,520 | $30,000 |
| 2013 | $788 | $38,260 | $9,520 | $28,740 |
Source: Public Records
Map
Nearby Homes
- 4220 Tannybrooke Ln NW Unit B
- VL Edgemont St NW
- VL 38th St NW
- 4628 Westwood Ave NW
- 0 Elberta Ave SW
- 4646 Woodside Ave NW
- 1443 Wilkshire Cir SW
- 3878 36th St NW
- 4072 Lindbergh Ave NW
- 3650 Overhill Dr NW
- 4740 Echoglenn St NW
- 1276 Linwood Ave SW
- 2525 44th St NW
- 3945 Arbor Creek Ave NW
- 2521 44th St NW
- 0 Munson St NW Unit 5092861
- 256 Everhard Rd SW
- 4205 Sanborn Ave NW
- 4987 Searls Dr NW
- 4263 Belden Greens Cir NW
- 4127 Tannybrooke Ln NW Unit 7D
- 4127 Tannybrooke Ln NW Unit 7C
- 4127 Tannybrooke Ln NW Unit 7A
- 4127 Tannybrooke Ln NW
- 4123 Tannybrooke Ln NW Unit 6D
- 4123 Tannybrooke Ln NW Unit 6C
- 4123 Tannybrooke Ln NW Unit 6B
- 4123 Tannybrooke Ln NW Unit 6A
- 4123 Tannybrooke Ln NW Unit B
- 4205 Tannybrooke Ln NW Unit 5D
- 4205 Tannybrooke Ln NW Unit 5C
- 4205 Tannybrooke Ln NW Unit 5B
- 4205 Tannybrooke Ln NW Unit 5A
- 4205 Tannybrooke Ln NW Unit 5
- 4205 Tannybrooke Ln NW Unit D
- 4109 Tannybrooke Ln NW Unit D
- 4109 Tannybrooke Ln NW Unit 9D
- 4109 Tannybrooke Ln NW Unit 9C
- 4109 Tannybrooke Ln NW Unit 9B
- 4109 Tannybrooke Ln NW Unit 9A