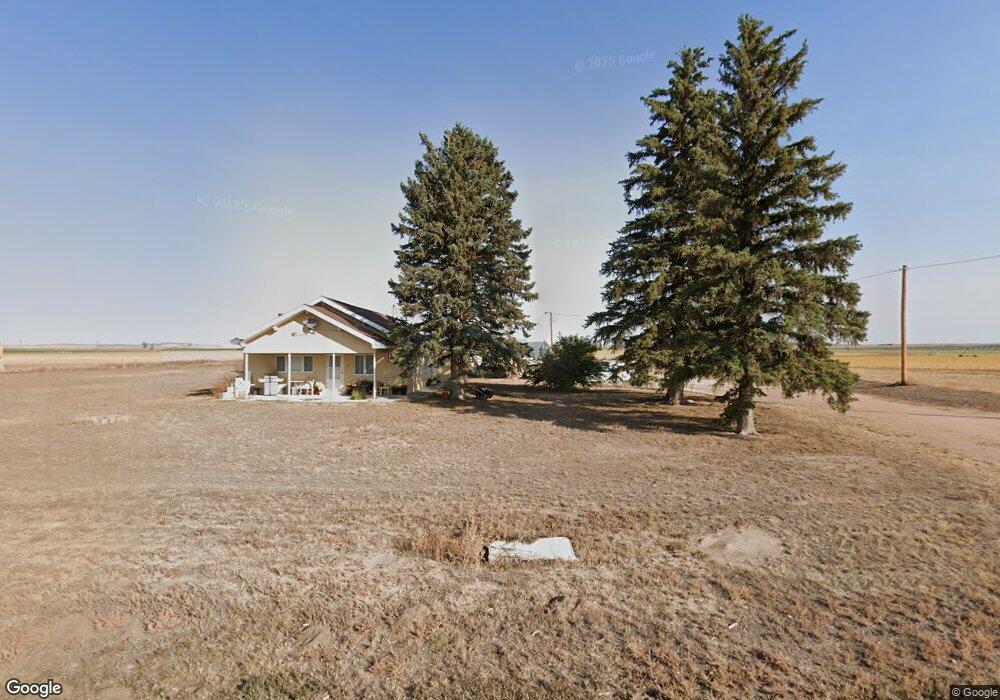
4128 Buttermilk Rd Torrington, WY 82240
Estimated Value: $220,987 - $294,000
2
Beds
1
Bath
1,488
Sq Ft
$174/Sq Ft
Est. Value
About This Home
This home is located at 4128 Buttermilk Rd, Torrington, WY 82240 and is currently estimated at $258,747, approximately $173 per square foot. 4128 Buttermilk Rd is a home located in Goshen County with nearby schools including Lincoln Elementary School, Trail Elementary School, and Torrington Middle School.
Ownership History
Date
Name
Owned For
Owner Type
Purchase Details
Closed on
Dec 22, 2020
Sold by
Teresa Marie Bloodgood Revocable Trust and Bloodgood Teresa Marie
Bought by
Bloodgood Teresa M
Current Estimated Value
Home Financials for this Owner
Home Financials are based on the most recent Mortgage that was taken out on this home.
Original Mortgage
$92,200
Outstanding Balance
$82,045
Interest Rate
2.8%
Mortgage Type
New Conventional
Estimated Equity
$176,702
Purchase Details
Closed on
Jun 30, 2005
Sold by
Schlagel Bryan L and Schlagel Bryan Lee
Bought by
Bloodgood Tim S and Bloodgood Teresa M
Home Financials for this Owner
Home Financials are based on the most recent Mortgage that was taken out on this home.
Original Mortgage
$109,250
Interest Rate
5.64%
Create a Home Valuation Report for This Property
The Home Valuation Report is an in-depth analysis detailing your home's value as well as a comparison with similar homes in the area
Home Values in the Area
Average Home Value in this Area
Purchase History
| Date | Buyer | Sale Price | Title Company |
|---|---|---|---|
| Bloodgood Teresa M | -- | First American Title | |
| Bloodgood Teresa M | -- | First American Title | |
| Bloodgood Tim S | -- | -- |
Source: Public Records
Mortgage History
| Date | Status | Borrower | Loan Amount |
|---|---|---|---|
| Open | Bloodgood Teresa M | $92,200 | |
| Closed | Bloodgood Teresa M | $92,200 | |
| Previous Owner | Bloodgood Tim S | $109,250 |
Source: Public Records
Tax History Compared to Growth
Tax History
| Year | Tax Paid | Tax Assessment Tax Assessment Total Assessment is a certain percentage of the fair market value that is determined by local assessors to be the total taxable value of land and additions on the property. | Land | Improvement |
|---|---|---|---|---|
| 2025 | $1,260 | $13,970 | $2,277 | $11,693 |
| 2024 | $1,260 | $17,920 | $3,110 | $14,810 |
| 2023 | $1,221 | $17,368 | $3,110 | $14,258 |
| 2022 | $1,044 | $14,849 | $2,879 | $11,970 |
| 2021 | $938 | $13,337 | $2,858 | $10,479 |
| 2020 | $911 | $12,959 | $2,837 | $10,122 |
| 2019 | $843 | $11,989 | $2,816 | $9,173 |
| 2018 | $826 | $11,752 | $2,757 | $8,995 |
| 2017 | $808 | $11,492 | $2,706 | $8,786 |
| 2016 | $825 | $11,731 | $2,563 | $9,168 |
| 2015 | -- | $11,542 | $2,563 | $8,979 |
| 2014 | -- | $10,116 | $2,563 | $7,553 |
Source: Public Records
Map
Nearby Homes
- 4142 Hwy
- 4374 Road 74t
- 4374 Road 75 A Unit Road 74T
- 7278 Road 43n
- 4362 U S 26
- Rd Yoder St
- 221 Cactus Dr
- 501 Sage Dr
- 4530 Mckenna Rd E
- 4714 Latigo Loop Rd
- 3674 Campbell Dr
- 3649 Campbell Dr
- 3710 Johnson St
- 3634 Converse St
- 4711 Hope Rd
- 3609 Bighorn St
- 3262 Buena Vista Rd
- 7297 Road 33
- 409 Clover Ave
- 805 Freimuth Ave