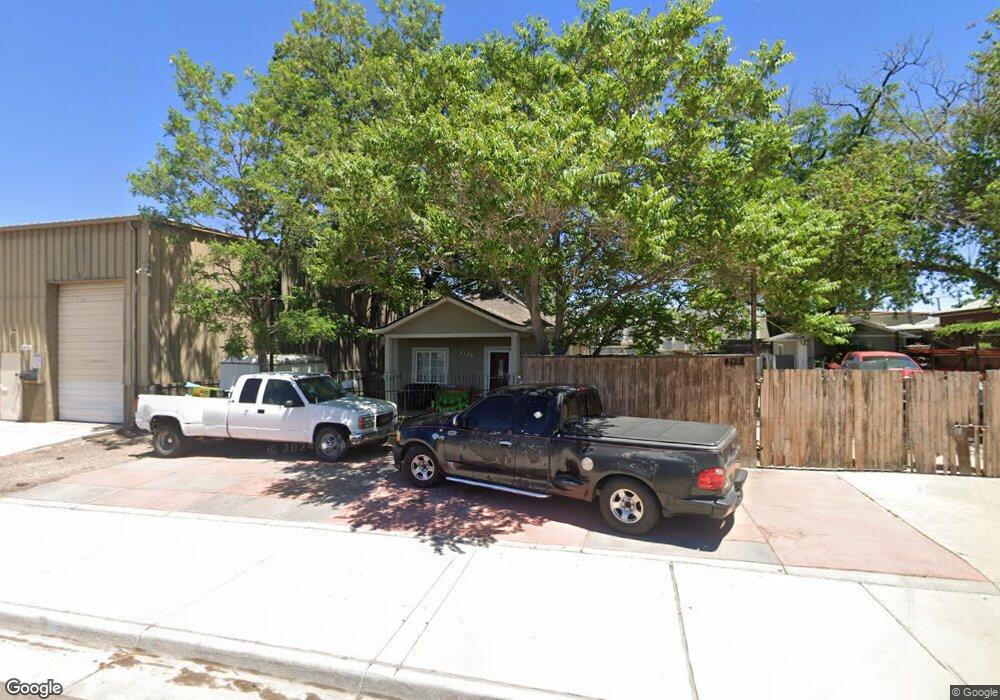
4128 Monroe St Denver, CO 80216
Elyria-Swansea NeighborhoodEstimated Value: $295,438 - $389,000
1
Bed
1
Bath
678
Sq Ft
$516/Sq Ft
Est. Value
About This Home
This home is located at 4128 Monroe St, Denver, CO 80216 and is currently estimated at $349,860, approximately $516 per square foot. 4128 Monroe St is a home located in Denver County with nearby schools including International Academy of Denver at Harrington, Whittier ECE-8 School, and Bruce Randolph School.
Ownership History
Date
Name
Owned For
Owner Type
Purchase Details
Closed on
Sep 23, 2002
Sold by
Terrazas Morel Lerma and Martinez Angelica
Bought by
Lerma Morel and Martinez Angelica
Current Estimated Value
Home Financials for this Owner
Home Financials are based on the most recent Mortgage that was taken out on this home.
Original Mortgage
$137,105
Outstanding Balance
$56,646
Interest Rate
6.09%
Mortgage Type
FHA
Estimated Equity
$293,214
Purchase Details
Closed on
Jun 5, 2000
Sold by
Lopez Gabriel L
Bought by
Terrazas Morel Lerma and Martinez Angelica
Home Financials for this Owner
Home Financials are based on the most recent Mortgage that was taken out on this home.
Original Mortgage
$139,070
Interest Rate
8.13%
Mortgage Type
FHA
Purchase Details
Closed on
Feb 24, 2000
Sold by
Lopez Thelma Faye and Mackeelin Thelma Faye
Bought by
Lopez Gabriel L
Purchase Details
Closed on
Mar 25, 1999
Sold by
Faye Lopez Thelma
Bought by
Lopez Gabriel L
Create a Home Valuation Report for This Property
The Home Valuation Report is an in-depth analysis detailing your home's value as well as a comparison with similar homes in the area
Home Values in the Area
Average Home Value in this Area
Purchase History
| Date | Buyer | Sale Price | Title Company |
|---|---|---|---|
| Lerma Morel | -- | -- | |
| Terrazas Morel Lerma | $140,000 | -- | |
| Lopez Gabriel L | -- | -- | |
| Lopez Gabriel L | -- | -- |
Source: Public Records
Mortgage History
| Date | Status | Borrower | Loan Amount |
|---|---|---|---|
| Open | Lerma Morel | $137,105 | |
| Closed | Terrazas Morel Lerma | $139,070 |
Source: Public Records
Tax History Compared to Growth
Tax History
| Year | Tax Paid | Tax Assessment Tax Assessment Total Assessment is a certain percentage of the fair market value that is determined by local assessors to be the total taxable value of land and additions on the property. | Land | Improvement |
|---|---|---|---|---|
| 2024 | $1,445 | $18,240 | $13,070 | $5,170 |
| 2023 | $1,413 | $18,240 | $13,070 | $5,170 |
| 2022 | $2,251 | $28,310 | $28,240 | $70 |
| 2021 | $2,251 | $29,120 | $29,050 | $70 |
| 2020 | $1,292 | $17,410 | $13,410 | $4,000 |
| 2019 | $1,256 | $17,410 | $13,410 | $4,000 |
| 2018 | $790 | $10,210 | $3,150 | $7,060 |
| 2017 | $788 | $10,210 | $3,150 | $7,060 |
| 2016 | $636 | $7,800 | $2,491 | $5,309 |
| 2015 | $609 | $7,800 | $2,491 | $5,309 |
| 2014 | $335 | $4,030 | $2,491 | $1,539 |
Source: Public Records
Map
Nearby Homes
- 3984 Cook St
- 4337 Cook St
- 3892 N Cook St
- 3854 Cook St
- 4329 Steele St
- 3855 Cook St
- 3815 N Madison St
- 4024 Milwaukee St
- 4016 Milwaukee St
- 4144 Fillmore St
- 4100 Albion St Unit 523
- 4100 Albion St Unit 320
- 4100 Albion St Unit 321
- 4415 Milwaukee St
- 4021 Fillmore St
- 3651 N Madison St
- 3649 Garfield St
- 3656 Adams St
- 4320 Clayton St
- 3220 E 37th Ave
- 4120 Monroe St
- 4110 Monroe St
- 4110 N Monroe St
- 4115 Garfield St
- 4134 Garfield St
- 4118 Garfield St
- 4134 Madison St
- 4128 Madison St
- 4100 Garfield St
- 4050 Madison St
- 4137 Madison St
- 4129 Madison St
- 4129 Madison St
- 4151 Madison St
- 4111 Madison St
- 4121 Madison St
- 4103 Madison St
- 4161 Madison St
- 4141 Madison St
- 4145 Jackson St