Estimated Value: $466,000 - $734,000
Studio
--
Bath
2,732
Sq Ft
$209/Sq Ft
Est. Value
About This Home
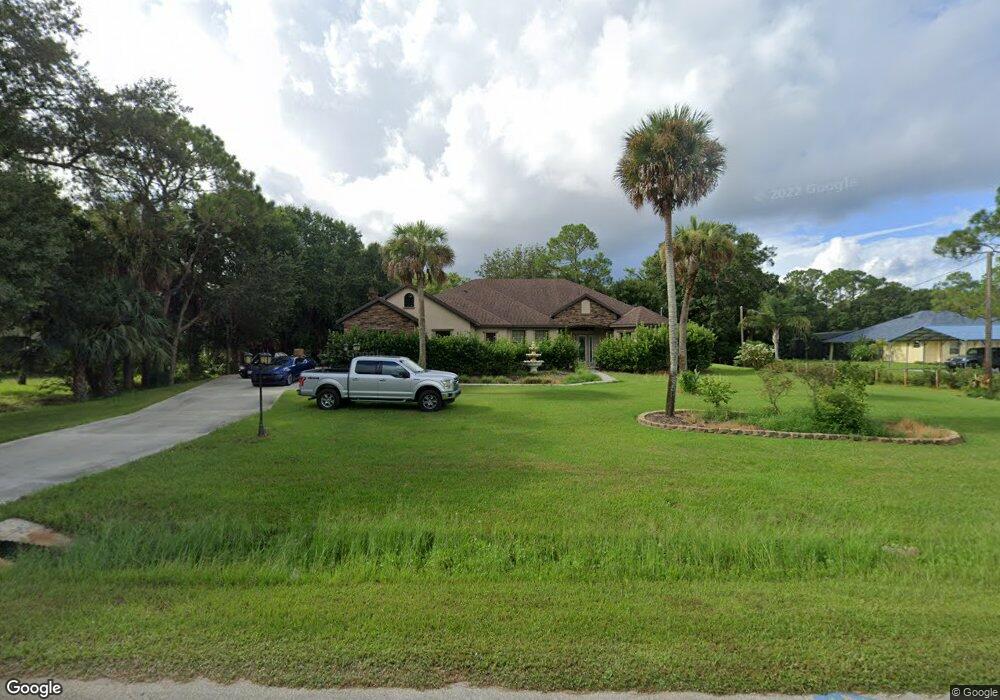
This home is located at 4129 Rayburn Rd, Cocoa, FL 32926 and is currently estimated at $571,914, approximately $209 per square foot. 4129 Rayburn Rd is a home with nearby schools including Cocoa High School, Saturn Elementary School, and Space Coast Christian Academy.
Ownership History
Date
Name
Owned For
Owner Type
Purchase Details
Closed on
May 1, 2016
Bought by
Langford Sidney
Current Estimated Value
Purchase Details
Closed on
Sep 12, 2014
Sold by
Grove Sharon Y
Bought by
Langford Sidney L and Langford Shelia L
Purchase Details
Closed on
Dec 5, 2005
Sold by
Grove Grove Sharon Y Sharon Y
Bought by
Grove Sharon Y and Michael L Grove Trust
Purchase Details
Closed on
Oct 18, 2004
Sold by
Grove Michael L and Grove Sharon Y
Bought by
Grove Michael L and Grove Sharon Y
Purchase Details
Closed on
Aug 5, 2003
Sold by
Grove Michael L and Grove Sharon Y
Bought by
Halliday David J and Halliday Robin L
Purchase Details
Closed on
Jan 21, 2003
Sold by
Clager Lloyd A and Clager Patricia C
Bought by
Grove Michael L and Grove Sharon Y
Create a Home Valuation Report for This Property
The Home Valuation Report is an in-depth analysis detailing your home's value as well as a comparison with similar homes in the area
Home Values in the Area
Average Home Value in this Area
Purchase History
| Date | Buyer | Sale Price | Title Company |
|---|---|---|---|
| Langford Sidney | -- | -- | |
| Langford Sidney L | $50,000 | Aurora Title | |
| Grove Sharon Y | -- | -- | |
| Grove Michael L | -- | -- | |
| Halliday David J | -- | -- | |
| Stocks Christopher J | -- | -- | |
| Grove Michael L | $112,000 | -- | |
| Grove Michael L | -- | -- |
Source: Public Records
Tax History
| Year | Tax Paid | Tax Assessment Tax Assessment Total Assessment is a certain percentage of the fair market value that is determined by local assessors to be the total taxable value of land and additions on the property. | Land | Improvement |
|---|---|---|---|---|
| 2025 | $4,787 | $373,140 | -- | -- |
| 2024 | $4,732 | $362,630 | -- | -- |
| 2023 | $4,732 | $352,070 | $0 | $0 |
| 2022 | $4,496 | $341,820 | $0 | $0 |
| 2021 | $4,627 | $331,870 | $0 | $0 |
| 2020 | $4,558 | $327,290 | $0 | $0 |
| 2019 | $4,523 | $319,940 | $44,080 | $275,860 |
| 2018 | $846 | $44,080 | $44,080 | $0 |
| 2017 | $664 | $11,020 | $0 | $0 |
| 2016 | $621 | $38,280 | $38,280 | $0 |
| 2015 | $636 | $38,280 | $38,280 | $0 |
| 2014 | $539 | $31,900 | $31,900 | $0 |
Source: Public Records
Map
Nearby Homes
- 4005 Pinyon Dr
- 1870 Britt Rd
- TBD Rayburn Rd
- 2212 Spring Cir
- 3808 Arrowsmith Dr
- 3802 Arrowsmith Dr
- 3813 Stonemont Dr
- 3816 Parapet Dr
- 4550 Highway 524
- 3806 Parapet Dr
- 3728 W Malory Ct
- 4920 Shade Tree St
- 3723 W Malory Ct
- 3660 Longbow Rd
- 4651 N Friday Cir
- 3487 Rocky Gap Place
- 4300 James Rd
- 4630 James Rd
- 000 James Rd
- 4600 Janet Rd
Your Personal Tour Guide
Ask me questions while you tour the home.