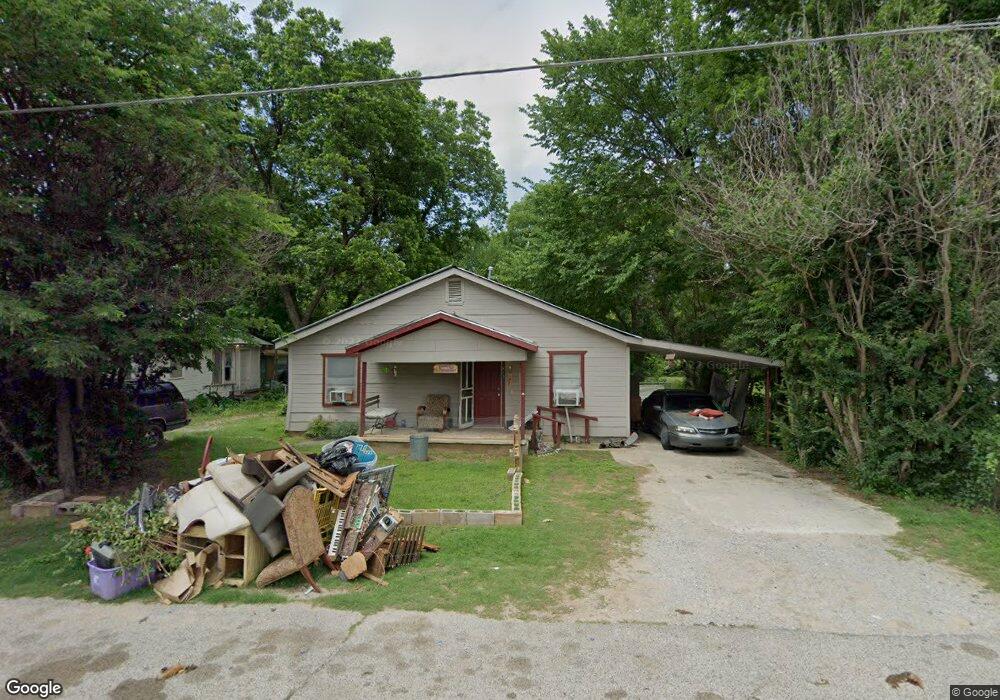
413 3rd Ave SE Ardmore, OK 73401
Estimated Value: $55,000 - $101,000
3
Beds
1
Bath
1,376
Sq Ft
$56/Sq Ft
Est. Value
About This Home
This home is located at 413 3rd Ave SE, Ardmore, OK 73401 and is currently estimated at $76,872, approximately $55 per square foot. 413 3rd Ave SE is a home located in Carter County with nearby schools including Jefferson Elementary School, Ardmore Middle School, and Ardmore High School.
Ownership History
Date
Name
Owned For
Owner Type
Purchase Details
Closed on
Feb 11, 2025
Sold by
Jared Investors Group Services Llc
Bought by
Rosales Property Llc
Current Estimated Value
Home Financials for this Owner
Home Financials are based on the most recent Mortgage that was taken out on this home.
Original Mortgage
$40,990
Outstanding Balance
$40,612
Interest Rate
7.04%
Mortgage Type
New Conventional
Estimated Equity
$36,260
Purchase Details
Closed on
Jan 6, 2025
Sold by
Jones Brannon and Jones Jamie
Bought by
Jared Investors Group Services Llc
Home Financials for this Owner
Home Financials are based on the most recent Mortgage that was taken out on this home.
Original Mortgage
$40,990
Outstanding Balance
$40,612
Interest Rate
7.04%
Mortgage Type
New Conventional
Estimated Equity
$36,260
Purchase Details
Closed on
Nov 28, 1981
Sold by
Johnson Finis F
Bought by
Miller Don Wallace and Miller B
Create a Home Valuation Report for This Property
The Home Valuation Report is an in-depth analysis detailing your home's value as well as a comparison with similar homes in the area
Purchase History
| Date | Buyer | Sale Price | Title Company |
|---|---|---|---|
| Rosales Property Llc | $56,000 | First American Title | |
| Rosales Property Llc | $56,000 | First American Title | |
| Jared Investors Group Services Llc | $6,000 | First American Title | |
| Miller Don Wallace | $9,000 | -- |
Source: Public Records
Mortgage History
| Date | Status | Borrower | Loan Amount |
|---|---|---|---|
| Open | Rosales Property Llc | $40,990 | |
| Closed | Rosales Property Llc | $40,990 |
Source: Public Records
Tax History
| Year | Tax Paid | Tax Assessment Tax Assessment Total Assessment is a certain percentage of the fair market value that is determined by local assessors to be the total taxable value of land and additions on the property. | Land | Improvement |
|---|---|---|---|---|
| 2025 | $928 | $9,301 | $900 | $8,401 |
| 2024 | $882 | $8,930 | $900 | $8,030 |
| 2023 | $840 | $8,505 | $900 | $7,605 |
| 2022 | $250 | $2,610 | $297 | $2,313 |
| 2021 | $251 | $2,486 | $281 | $2,205 |
| 2020 | $235 | $2,368 | $264 | $2,104 |
| 2019 | $219 | $2,254 | $255 | $1,999 |
| 2018 | $212 | $2,147 | $237 | $1,910 |
| 2017 | $187 | $2,045 | $212 | $1,833 |
| 2016 | $182 | $1,948 | $265 | $1,683 |
| 2015 | $143 | $1,856 | $262 | $1,594 |
| 2014 | $136 | $1,767 | $262 | $1,505 |
Source: Public Records
Map
Nearby Homes