Estimated Value: $241,045 - $259,000
--
Bed
2
Baths
1,411
Sq Ft
$175/Sq Ft
Est. Value
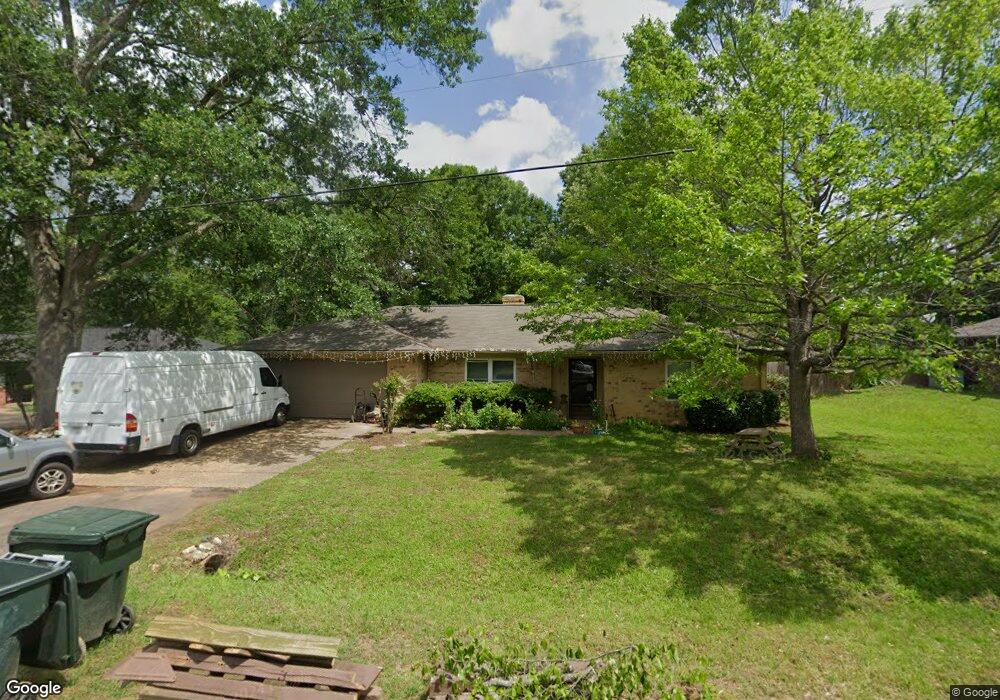
About This Home
This home is located at 413 413 Brigadoon, Tyler, TX 75703 and is currently estimated at $247,011, approximately $175 per square foot. 413 413 Brigadoon is a home located in Smith County with nearby schools including Dr. Bryan C. Jack Elementary School, Hubbard Middle School, and Tyler Legacy High School.
Ownership History
Date
Name
Owned For
Owner Type
Purchase Details
Closed on
Sep 30, 2014
Sold by
Cooley Charles and Cooley Jennifer
Bought by
Weenink Zachary and Weenink Melissa
Current Estimated Value
Home Financials for this Owner
Home Financials are based on the most recent Mortgage that was taken out on this home.
Original Mortgage
$103,700
Outstanding Balance
$79,501
Interest Rate
4.1%
Mortgage Type
New Conventional
Estimated Equity
$167,510
Purchase Details
Closed on
Oct 27, 2011
Sold by
Joyce James M and Joyce Kathy S
Bought by
Cooley Charles and Cooley Jennifer
Home Financials for this Owner
Home Financials are based on the most recent Mortgage that was taken out on this home.
Original Mortgage
$110,135
Interest Rate
4.4%
Mortgage Type
FHA
Purchase Details
Closed on
Oct 1, 2007
Sold by
Henneous Jonathon M and Henneous Cynthia Ann
Bought by
Joyce James M and Joyce Kathy S
Home Financials for this Owner
Home Financials are based on the most recent Mortgage that was taken out on this home.
Original Mortgage
$80,000
Interest Rate
6.55%
Mortgage Type
Purchase Money Mortgage
Create a Home Valuation Report for This Property
The Home Valuation Report is an in-depth analysis detailing your home's value as well as a comparison with similar homes in the area
Home Values in the Area
Average Home Value in this Area
Purchase History
| Date | Buyer | Sale Price | Title Company |
|---|---|---|---|
| Weenink Zachary | -- | None Available | |
| Cooley Charles | -- | None Available | |
| Joyce James M | -- | None Available |
Source: Public Records
Mortgage History
| Date | Status | Borrower | Loan Amount |
|---|---|---|---|
| Open | Weenink Zachary | $103,700 | |
| Previous Owner | Cooley Charles | $110,135 | |
| Previous Owner | Joyce James M | $80,000 |
Source: Public Records
Tax History Compared to Growth
Tax History
| Year | Tax Paid | Tax Assessment Tax Assessment Total Assessment is a certain percentage of the fair market value that is determined by local assessors to be the total taxable value of land and additions on the property. | Land | Improvement |
|---|---|---|---|---|
| 2024 | $2,190 | $183,619 | $26,500 | $177,857 |
| 2023 | $2,910 | $183,977 | $26,500 | $157,477 |
| 2022 | $2,973 | $162,552 | $26,500 | $136,052 |
| 2021 | $2,894 | $137,955 | $26,500 | $111,455 |
| 2020 | $2,802 | $130,934 | $26,500 | $104,434 |
| 2019 | $2,716 | $124,224 | $17,225 | $106,999 |
| 2018 | $2,614 | $120,195 | $17,225 | $102,970 |
| 2017 | $2,592 | $121,420 | $13,250 | $108,170 |
| 2016 | $2,448 | $114,660 | $13,250 | $101,410 |
| 2015 | $2,304 | $113,309 | $13,250 | $100,059 |
| 2014 | $2,304 | $108,442 | $13,250 | $95,192 |
Source: Public Records
Map
Nearby Homes
- 9352 Brigadoon St
- 9451 & 9456 Saint Patrick Place
- 408 Ulster Dr
- 318 Ulster Dr
- 14 Marsh Farm Rd
- 13 Marsh Farm Rd
- 19 Marsh Farm Rd
- 18 Marsh Farm Rd
- 17 Marsh Farm Rd
- 16 Marsh Farm Rd
- 9 Marsh Farm Rd
- 15 Marsh Farm Rd
- 12 Marsh Farm Rd
- 11 Marsh Farm Rd
- 10 Marsh Farm Rd
- 421 W Cumberland Rd
- 421 W Cumberland Rd Unit 1402
- 231 W Cumberland Rd
- 9065 Long Branch
- 413 Brigadoon St
- 417 Brigadoon St
- 409 409 Brigadoon
- 409 Brigadoon St
- 418 Dublin Ave
- 412 Brigadoon St
- 414 Dublin Ave
- 422 Dublin Ave
- 416 Brigadoon St
- 421 Brigadoon St
- 408 Brigadoon St
- 405 Brigadoon St
- 410 Dublin Ave
- 420 Brigadoon St
- 426 Dublin Ave
- 404 Brigadoon St
- 425 Brigadoon St
- 425 425 Brigadoon
- 409 Blarney Stone St
- 403 Brigadoon St