413 Chandler St Worcester, MA 01602
Elm Park NeighborhoodEstimated Value: $508,576
Studio
--
Bath
3,183
Sq Ft
$160/Sq Ft
Est. Value
About This Home
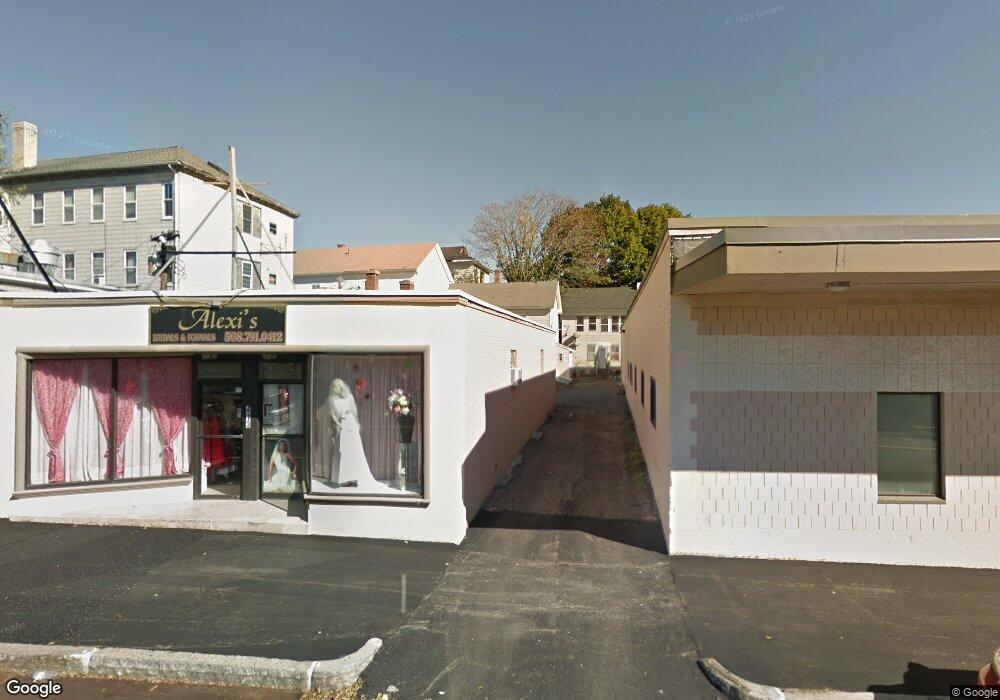
This home is located at 413 Chandler St, Worcester, MA 01602 and is currently estimated at $508,576, approximately $159 per square foot. 413 Chandler St is a home located in Worcester County with nearby schools including Chandler Magnet, Jacob Hiatt Magnet School, and Midland Street.
Ownership History
Date
Name
Owned For
Owner Type
Purchase Details
Closed on
Jul 23, 2019
Sold by
Ngo Ty and Ngo Lan
Bought by
Ngo Ty and Ngo Lan
Current Estimated Value
Home Financials for this Owner
Home Financials are based on the most recent Mortgage that was taken out on this home.
Original Mortgage
$92,500
Outstanding Balance
$80,358
Interest Rate
3.73%
Mortgage Type
New Conventional
Estimated Equity
$428,218
Purchase Details
Closed on
Mar 4, 2013
Sold by
Ben Real Estate Llc
Bought by
Ngo Ty and Ngo Lan
Home Financials for this Owner
Home Financials are based on the most recent Mortgage that was taken out on this home.
Original Mortgage
$130,000
Interest Rate
3.43%
Mortgage Type
Commercial
Purchase Details
Closed on
Feb 16, 2005
Sold by
Ben-Naim Yoram
Bought by
Ben Re Llc
Purchase Details
Closed on
Feb 14, 2005
Sold by
Ben Re Llc
Bought by
Ben-Naim Yoram
Purchase Details
Closed on
Oct 21, 2003
Sold by
Ben-Naim Yourm
Bought by
Ben Rlest Llc
Create a Home Valuation Report for This Property
The Home Valuation Report is an in-depth analysis detailing your home's value as well as a comparison with similar homes in the area
Home Values in the Area
Average Home Value in this Area
Purchase History
| Date | Buyer | Sale Price | Title Company |
|---|---|---|---|
| Ngo Ty | -- | -- | |
| Ngo Ty | $230,000 | -- | |
| Ngo Ty | $230,000 | -- | |
| Ben Re Llc | -- | -- | |
| Ben Re Llc | -- | -- | |
| Ben-Naim Yoram | -- | -- | |
| Ben-Naim Yoram | -- | -- | |
| Ben Rlest Llc | -- | -- | |
| Ben Rlest Llc | -- | -- | |
| Ben Rlest Llc | -- | -- |
Source: Public Records
Mortgage History
| Date | Status | Borrower | Loan Amount |
|---|---|---|---|
| Open | Ngo Ty | $92,500 | |
| Previous Owner | Ngo Ty | $130,000 |
Source: Public Records
Tax History
| Year | Tax Paid | Tax Assessment Tax Assessment Total Assessment is a certain percentage of the fair market value that is determined by local assessors to be the total taxable value of land and additions on the property. | Land | Improvement |
|---|---|---|---|---|
| 2025 | $12,488 | $436,500 | $206,600 | $229,900 |
| 2024 | $11,680 | $388,800 | $206,600 | $182,200 |
| 2023 | $9,134 | $292,200 | $179,600 | $112,600 |
| 2022 | $9,739 | $292,200 | $179,600 | $112,600 |
| 2021 | $10,798 | $298,300 | $137,000 | $161,300 |
| 2020 | $10,488 | $298,300 | $137,000 | $161,300 |
| 2019 | $10,229 | $293,100 | $133,400 | $159,700 |
| 2018 | $9,893 | $290,700 | $133,400 | $157,300 |
| 2017 | $9,573 | $290,700 | $133,400 | $157,300 |
| 2016 | $9,222 | $271,400 | $117,700 | $153,700 |
| 2015 | $8,612 | $271,400 | $117,700 | $153,700 |
| 2014 | $8,367 | $271,400 | $117,700 | $153,700 |
Source: Public Records
Map
Nearby Homes
- 33 Carlisle St
- 9 Fiske St Unit A
- 4 Hartshorn Ave
- 24 Hadwen Rd
- 24 Geneva St
- 28 Walworth St
- 60 June St
- 15 Longfellow Rd
- 108 Longfellow Rd
- 16 Sherwood Rd
- 5 Franconia St
- 18 Hadwen Ln
- 10 Minthorne St
- 6 Newton Ave
- 34 Rosslare Dr Unit 108
- 9 Englewood Ave
- 3 Suburban Rd
- 345 Park Ave
- 114 Lovell St
- 15 Circuit Ave E
- 118A June St
- 118A June St Unit A
- 118 June St Unit A
- 118 June St
- 118 June St Unit 2F
- 118 June St Unit 2R
- 118 June St Unit 3R
- 116R June St
- 116 June St
- 116 June St Unit 3
- 116 June St Unit 1
- 120 June St
- 114R June St
- 411 Chandler St
- 114 June St
- 114 June St Unit 2
- 114 June St Unit 3
- 112 June St
- 6 Reed St
- 2 Carlisle St Unit 2
Your Personal Tour Guide
Ask me questions while you tour the home.