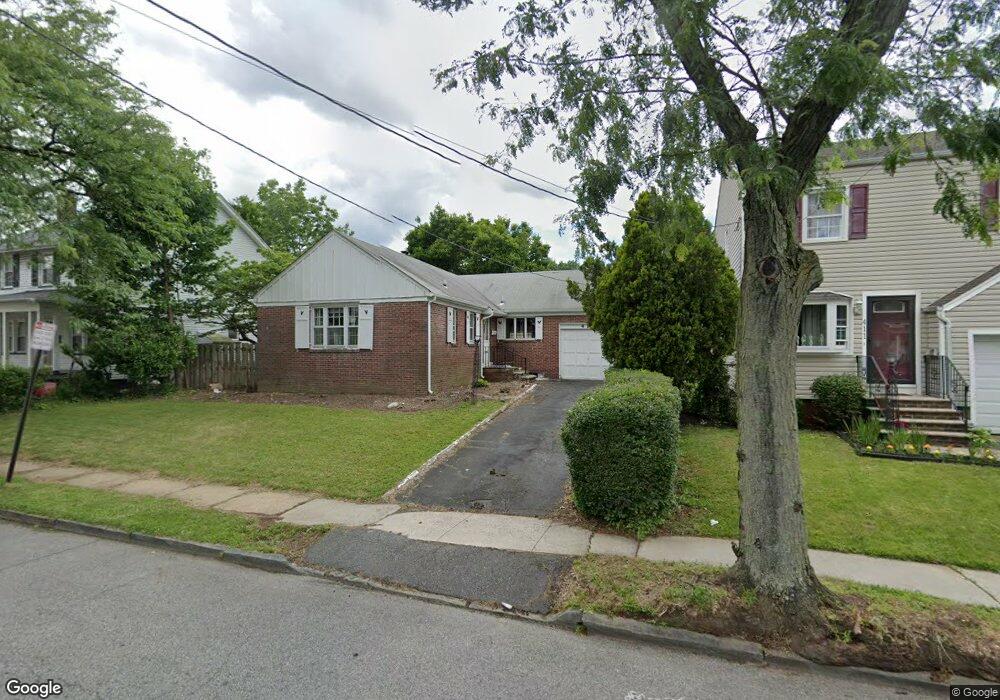
413 Chapman St Irvington, NJ 07111
Estimated Value: $365,821 - $489,000
--
Bed
--
Bath
1,167
Sq Ft
$355/Sq Ft
Est. Value
About This Home
This home is located at 413 Chapman St, Irvington, NJ 07111 and is currently estimated at $414,705, approximately $355 per square foot. 413 Chapman St is a home located in Essex County with nearby schools including Irvington High School and St. John the Baptist Ukraini.
Ownership History
Date
Name
Owned For
Owner Type
Purchase Details
Closed on
Apr 14, 2021
Sold by
Etienne Luckson
Bought by
Pierrelouis Steve
Current Estimated Value
Home Financials for this Owner
Home Financials are based on the most recent Mortgage that was taken out on this home.
Original Mortgage
$205,000
Outstanding Balance
$185,386
Interest Rate
3.1%
Mortgage Type
Commercial
Estimated Equity
$229,319
Purchase Details
Closed on
Sep 10, 2018
Sold by
Colucci Leona Est
Bought by
First Newark Capital Ent
Create a Home Valuation Report for This Property
The Home Valuation Report is an in-depth analysis detailing your home's value as well as a comparison with similar homes in the area
Home Values in the Area
Average Home Value in this Area
Purchase History
| Date | Buyer | Sale Price | Title Company |
|---|---|---|---|
| Pierrelouis Steve | $205,000 | Westcor Land Title Ins Co | |
| First Newark Capital Ent | $1,000 | -- |
Source: Public Records
Mortgage History
| Date | Status | Borrower | Loan Amount |
|---|---|---|---|
| Open | Pierrelouis Steve | $205,000 |
Source: Public Records
Tax History Compared to Growth
Tax History
| Year | Tax Paid | Tax Assessment Tax Assessment Total Assessment is a certain percentage of the fair market value that is determined by local assessors to be the total taxable value of land and additions on the property. | Land | Improvement |
|---|---|---|---|---|
| 2025 | $7,446 | $360,300 | $167,400 | $192,900 |
| 2024 | $7,446 | $122,600 | $25,800 | $96,800 |
| 2022 | $7,308 | $122,600 | $25,800 | $96,800 |
| 2021 | $7,330 | $122,600 | $25,800 | $96,800 |
| 2020 | $7,327 | $122,600 | $25,800 | $96,800 |
| 2019 | $7,128 | $122,600 | $25,800 | $96,800 |
| 2018 | $6,989 | $122,600 | $25,800 | $96,800 |
| 2017 | $6,958 | $122,600 | $25,800 | $96,800 |
| 2016 | $6,807 | $122,600 | $25,800 | $96,800 |
| 2015 | $6,649 | $122,600 | $25,800 | $96,800 |
| 2014 | $6,689 | $122,600 | $25,800 | $96,800 |
Source: Public Records
Map
Nearby Homes
- 889 Sanford Ave
- 900 Sanford Ave Unit 902
- 90 Mountain View Place
- 40 Newton Place
- 183 Ellery Ave
- 1371 Clinton Ave Unit 1373
- 101 Mountainview Place
- 24 Ridgewood Ave
- 1373 Clinton Ave
- 213 Kerrigan Blvd
- 326-328 Eastern Pkwy
- 326 Eastern Pkwy Unit 328
- 307 Eastern Pkwy Unit 309
- 43 Rich St
- 39-41 Rich St
- 34 Sherman Place
- 40 Clinton Terrace
- 39 Grant Place
- 27-29 Cleveland Ave
- 27 Cleveland Ave Unit 29
- 411 Chapman St
- 421 Chapman St
- 407 Chapman St
- 423 Chapman St
- 858 Sanford Ave
- 854 Sanford Ave
- 862 Sanford Ave Unit 864
- 405 Chapman St
- 425 Chapman St
- 850 Sanford Ave
- 866 Sanford Ave
- 427 Chapman St
- 403 Chapman St
- 418 Chapman St
- 414 Chapman St
- 420 Chapman St
- 412 Chapman St
- 848 Sanford Ave
- 410 Chapman St
- 422 Chapman St