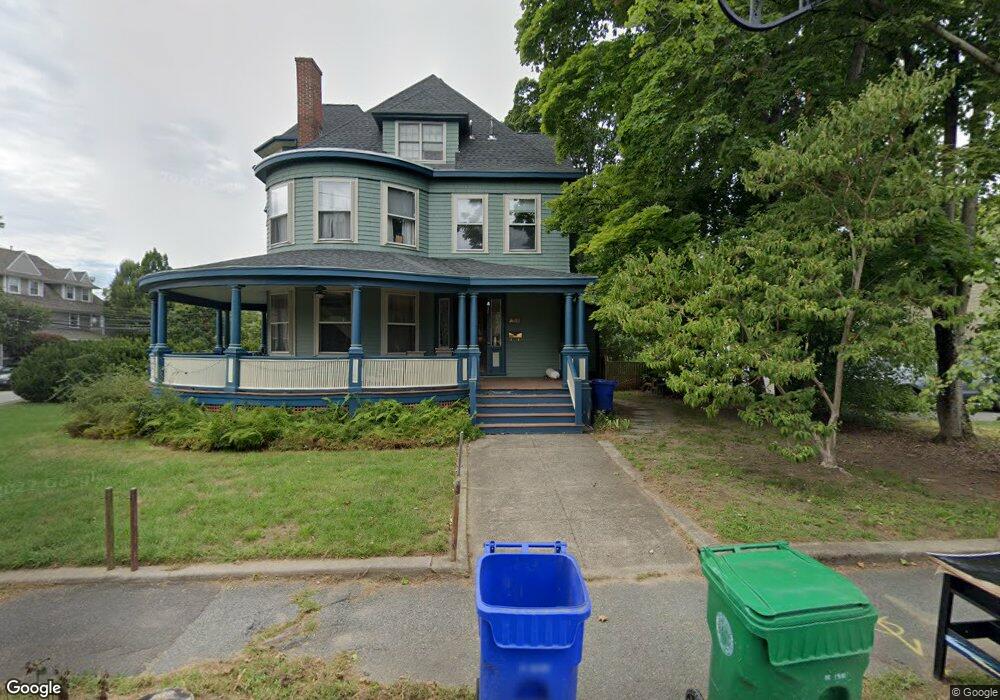
413 Cherry St West Newton, MA 02465
West Newton NeighborhoodEstimated Value: $1,260,000 - $1,850,582
About This Home
This home is located at 413 Cherry St, West Newton, MA 02465 and is currently estimated at $1,554,396, approximately $475 per square foot. 413 Cherry St is a home located in Middlesex County with nearby schools including Franklin Elementary School, C.C. Burr, and F.A. Day Middle School.
Ownership History
We collect this data history from publicly available records. To have your information removed, we recommend requesting removal directly through your county’s website.
Purchase Details
Home Financials for this Owner
Home Financials are based on the most recent Mortgage that was taken out on this home.Purchase Details
Home Values in the Area
Average Home Value in this Area
Purchase History
We collect this data history from publicly available records. To have your information removed, we recommend requesting removal directly through your county’s website.
| Date | Buyer | Sale Price | Title Company |
|---|---|---|---|
| -- | -- | ||
| $195,500 | -- |
Mortgage History
We collect this data history from publicly available records. To have your information removed, we recommend requesting removal directly through your county’s website.
| Date | Status | Borrower | Loan Amount |
|---|---|---|---|
| Open | $326,850 | ||
| Previous Owner | $320,000 | ||
| Previous Owner | $25,000 | ||
| Previous Owner | $247,000 |
Tax History
We collect this data history from publicly available records. To have your information removed, we recommend requesting removal directly through your county’s website.
| Year | Tax Paid | Tax Assessment Tax Assessment Total Assessment is a certain percentage of the fair market value that is determined by local assessors to be the total taxable value of land and additions on the property. | Land | Improvement |
|---|---|---|---|---|
| 2025 | $14,691 | $1,499,100 | $744,100 | $755,000 |
| 2024 | $14,205 | $1,455,400 | $722,400 | $733,000 |
| 2023 | $13,568 | $1,332,800 | $591,500 | $741,300 |
| 2022 | $12,983 | $1,234,100 | $547,700 | $686,400 |
| 2021 | $12,182 | $1,132,200 | $502,500 | $629,700 |
| 2020 | $11,820 | $1,132,200 | $502,500 | $629,700 |
| 2019 | $11,057 | $1,058,100 | $469,600 | $588,500 |
| 2018 | $11,043 | $1,020,600 | $440,700 | $579,900 |
| 2017 | $10,412 | $936,300 | $404,300 | $532,000 |
| 2016 | $9,775 | $859,000 | $370,900 | $488,100 |
| 2015 | -- | $802,800 | $346,600 | $456,200 |
Map
- 86 Webster St
- 58 River St
- 10 Elm St Unit 10
- 4 Elm St Unit 4
- 6 Elm St Unit 6
- 14 Elm St Unit 14
- 16 Elm St Unit 16
- 2 Elm St Unit 2
- 462 Waltham St
- 25 Alden Place
- 49 Shaw St
- 24 Mague Ave Unit 24
- 5 Rebecca Rd
- 21 Rose Dr
- 4 Rebecca Rd
- 32 Smith Ave
- 34 Pine St Unit 34
- 105 Adena Rd Unit 105
- 284 Webster St
- 182 Adams Ave
- 413 Cherry St Unit 1
- 67 Webster St
- 407 Cherry St
- 405 Cherry St Unit 1
- 405 Cherry St Unit 405
- 58 Webster St
- 60 Webster St
- 62 Webster St
- 56 Webster St
- 80 Elm St
- 76 Elm St
- 399 Cherry St
- 399 Cherry St Unit 399
- 399 Cherry St Unit 1
- 401 Cherry St
- 68 Elm St Unit 70
- 70 Elm St Unit 1
- 68 Elm St Unit 68
- 402 Cherry St Unit 402
- 90 Elm St
Ask me questions while you tour the home.