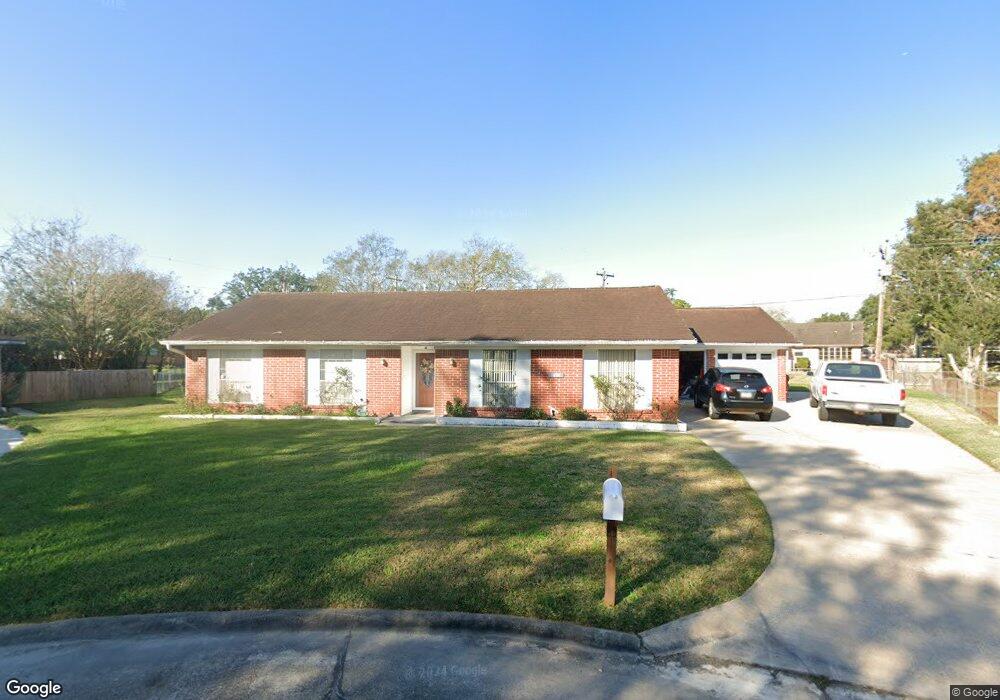
413 Christina Ln Friendswood, TX 77546
Estimated Value: $279,000 - $291,000
3
Beds
2
Baths
1,559
Sq Ft
$181/Sq Ft
Est. Value
About This Home
This home is located at 413 Christina Ln, Friendswood, TX 77546 and is currently estimated at $282,490, approximately $181 per square foot. 413 Christina Ln is a home located in Galveston County with nearby schools including Westwood Elementary School, Zue S. Bales Intermediate School, and Friendswood Junior High School.
Ownership History
Date
Name
Owned For
Owner Type
Purchase Details
Closed on
Feb 21, 2019
Sold by
Geistert Rebekah
Bought by
Anderson Adam
Current Estimated Value
Purchase Details
Closed on
Oct 5, 2018
Sold by
Zrubek William Scott and Zrubek Kimberly Ann
Bought by
Geistert Rebekah
Home Financials for this Owner
Home Financials are based on the most recent Mortgage that was taken out on this home.
Original Mortgage
$172,660
Interest Rate
4.5%
Mortgage Type
New Conventional
Purchase Details
Closed on
Aug 29, 2014
Sold by
King Sang S
Bought by
Zrubek Kimberly Ann and Zrubek William Scott
Home Financials for this Owner
Home Financials are based on the most recent Mortgage that was taken out on this home.
Original Mortgage
$108,000
Interest Rate
4.17%
Mortgage Type
New Conventional
Create a Home Valuation Report for This Property
The Home Valuation Report is an in-depth analysis detailing your home's value as well as a comparison with similar homes in the area
Home Values in the Area
Average Home Value in this Area
Purchase History
| Date | Buyer | Sale Price | Title Company |
|---|---|---|---|
| Anderson Adam | -- | None Available | |
| Geistert Rebekah | -- | None Available | |
| Zrubek Kimberly Ann | -- | Stewart Title |
Source: Public Records
Mortgage History
| Date | Status | Borrower | Loan Amount |
|---|---|---|---|
| Previous Owner | Geistert Rebekah | $172,660 | |
| Previous Owner | Zrubek Kimberly Ann | $108,000 |
Source: Public Records
Tax History Compared to Growth
Tax History
| Year | Tax Paid | Tax Assessment Tax Assessment Total Assessment is a certain percentage of the fair market value that is determined by local assessors to be the total taxable value of land and additions on the property. | Land | Improvement |
|---|---|---|---|---|
| 2025 | $3,442 | $261,259 | $24,053 | $237,206 |
| 2024 | $3,442 | $246,392 | -- | -- |
| 2023 | $3,442 | $223,993 | $0 | $0 |
| 2022 | $4,485 | $203,630 | $0 | $0 |
| 2021 | $4,324 | $225,440 | $24,420 | $201,020 |
| 2020 | $4,054 | $171,820 | $24,420 | $147,400 |
| 2019 | $3,885 | $152,990 | $24,420 | $128,570 |
| 2018 | $3,952 | $154,720 | $24,420 | $130,300 |
| 2017 | $3,678 | $141,610 | $24,420 | $117,190 |
| 2016 | $3,348 | $128,930 | $24,420 | $104,510 |
| 2015 | $1,402 | $123,430 | $24,420 | $99,010 |
| 2014 | $320 | $111,210 | $24,420 | $86,790 |
Source: Public Records
Map
Nearby Homes
- 409 Linda Ln
- 405 Linda Ln
- 401 Castlelake Dr
- 301 Brandywyne Dr
- 510 Portage Ln
- 308 Virginia Ln
- 415 Bellmar Ln
- 307 Bellmar Ln
- 511 Bellmar Ln
- 515 Brandywyne Dr
- 502 Bellmar Ln
- 514 Bellmar Ln
- 3901 Kimberly Dr
- 808 Merribrook Ln
- 207 Live Oak Ln
- 201 Live Oak Ln
- 3910 Kimberly Dr
- 111 Dunbar Estates Dr Unit 203
- 605 Tanglewood Dr
- 300 W Edgewood Dr
- 411 Christina Ln
- 409 Stratmore Dr
- 407 Stratmore Dr
- 411 Stratmore Dr
- 409 Castlelake Dr
- 414 Christina Ln
- 405 Stratmore Dr
- 407 Castlelake Dr
- 409 Christina Ln
- 403 Stratmore Dr
- 413 Stratmore Dr
- 412 Christina Ln
- 405 Castlelake Dr
- 410 Christina Ln
- 407 Christina Ln
- 401 Stratmore Dr
- 403 Castlelake Dr
- 500 Brendon Park Ln
- 411 Linda Ln
- 408 Christina Ln