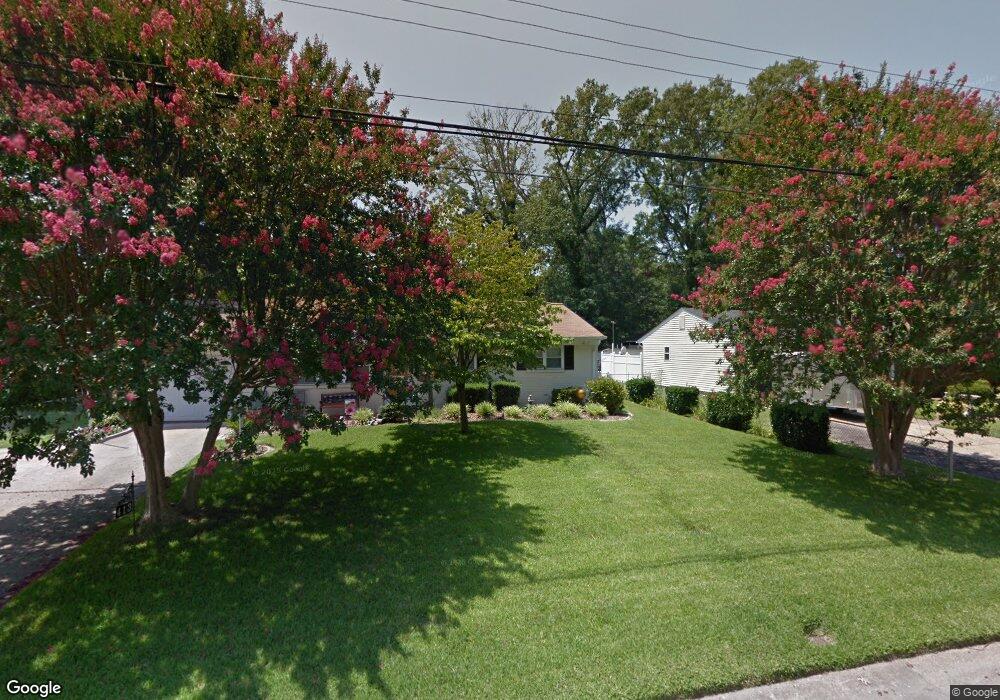
413 Dorset Ave Virginia Beach, VA 23462
Aragona Village NeighborhoodEstimated Value: $300,000 - $311,000
3
Beds
1
Bath
1,266
Sq Ft
$241/Sq Ft
Est. Value
About This Home
This home is located at 413 Dorset Ave, Virginia Beach, VA 23462 and is currently estimated at $305,335, approximately $241 per square foot. 413 Dorset Ave is a home located in Virginia Beach City with nearby schools including Pembroke Elementary School, Independence Middle School, and Bayside High School.
Ownership History
Date
Name
Owned For
Owner Type
Purchase Details
Closed on
Jan 14, 2019
Sold by
Herrera Willian Andres and Herrera Yudi Alejandra
Bought by
Martz Tyalan M and Pell Tiffany R
Current Estimated Value
Home Financials for this Owner
Home Financials are based on the most recent Mortgage that was taken out on this home.
Original Mortgage
$183,121
Outstanding Balance
$161,001
Interest Rate
4.6%
Mortgage Type
FHA
Estimated Equity
$144,334
Purchase Details
Closed on
Jul 29, 2014
Sold by
Herrera Cadena Willan A
Bought by
Herrera Cadena Willan A and Herrera Yudi A
Purchase Details
Closed on
Dec 11, 2012
Sold by
Duprey Devisee Sharon L and Lw And Tstmt Of Ruth M Duprey
Bought by
Herrera Cardena William A
Home Financials for this Owner
Home Financials are based on the most recent Mortgage that was taken out on this home.
Original Mortgage
$168,445
Interest Rate
3.44%
Mortgage Type
VA
Create a Home Valuation Report for This Property
The Home Valuation Report is an in-depth analysis detailing your home's value as well as a comparison with similar homes in the area
Home Values in the Area
Average Home Value in this Area
Purchase History
| Date | Buyer | Sale Price | Title Company |
|---|---|---|---|
| Martz Tyalan M | $186,500 | Attorney | |
| Herrera Cadena Willan A | -- | -- | |
| Herrera Cardena William A | $164,900 | -- |
Source: Public Records
Mortgage History
| Date | Status | Borrower | Loan Amount |
|---|---|---|---|
| Open | Martz Tyalan M | $183,121 | |
| Previous Owner | Herrera Cardena William A | $168,445 |
Source: Public Records
Tax History Compared to Growth
Tax History
| Year | Tax Paid | Tax Assessment Tax Assessment Total Assessment is a certain percentage of the fair market value that is determined by local assessors to be the total taxable value of land and additions on the property. | Land | Improvement |
|---|---|---|---|---|
| 2025 | $2,458 | $256,500 | $135,000 | $121,500 |
| 2024 | $2,458 | $253,400 | $135,000 | $118,400 |
| 2023 | $2,342 | $236,600 | $120,000 | $116,600 |
| 2022 | $2,086 | $210,700 | $103,200 | $107,500 |
| 2021 | $1,823 | $184,100 | $79,400 | $104,700 |
| 2020 | $1,866 | $183,400 | $79,400 | $104,000 |
| 2019 | $1,821 | $175,500 | $75,900 | $99,600 |
| 2018 | $1,759 | $175,500 | $75,900 | $99,600 |
| 2017 | $1,759 | $175,500 | $75,900 | $99,600 |
| 2016 | $1,681 | $169,800 | $75,900 | $93,900 |
| 2015 | $1,640 | $165,700 | $75,900 | $89,800 |
| 2014 | -- | $163,700 | $86,300 | $77,400 |
Source: Public Records
Map
Nearby Homes
- 437 Southgate Ave Unit X9604
- 500 Southgate Ave
- 528 Lavender Ln
- 504 N Witchduck Rd
- 505 Taldan Ct
- 5207 Richard Rd
- 516 Cape Joshua Ln
- 404 Osprey St
- 5228 Pirata Place
- 5289 Pirata Place
- 447 Peregrine St
- 609 Aragona Blvd
- 308 Gilead Trail
- 5316 Cottage Ct
- 419 Adkins Arch
- 621 Raff Rd
- 5343 Tuttle Creek Ct
- 5476 Kiawah Ct
- 609 Cunningham Rd
- 5425 Port Royal Dr
- 417 Dorset Ave
- 412 Brian Ave
- 421 Dorset Ave
- 408 Brian Ave
- 416 Brian Ave
- 405 Dorset Ave
- 412 Dorset Ave
- 404 Brian Ave
- 406 Dorset Ave
- 416 Dorset Ave
- 420 Brian Ave
- 425 Dorset Ave
- 420 Dorset Ave
- 401 Dorset Ave
- 402 Dorset Ave
- 402 Brian Ave
- 424 Brian Ave
- 400 Dorset Ave
- 424 Dorset Ave
- 5012 Jeanne St Unit X9701