Estimated Value: $74,000 - $157,000
--
Bed
1
Bath
832
Sq Ft
$146/Sq Ft
Est. Value
About This Home
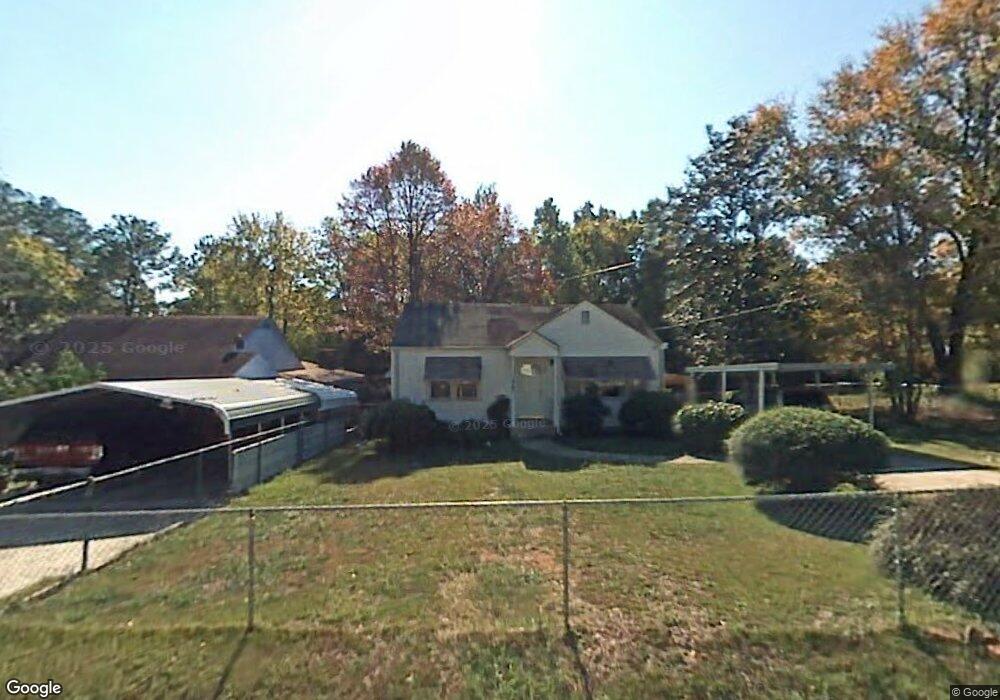
This home is located at 413 Edgewood Ave NW, Rome, GA 30165 and is currently estimated at $121,079, approximately $145 per square foot. 413 Edgewood Ave NW is a home located in Floyd County with nearby schools including Rome High School and St. Mary School.
Ownership History
Date
Name
Owned For
Owner Type
Purchase Details
Closed on
Nov 30, 2001
Sold by
Secretary Of Housing & Urban Development
Bought by
Johnson David
Current Estimated Value
Purchase Details
Closed on
Apr 3, 2001
Sold by
Wells Fargo Home Mortgage
Bought by
Secretary Of Housing & Urban Development
Purchase Details
Closed on
Feb 17, 2000
Sold by
Boatner Scott
Bought by
Boatner Scott and Boatner Shannon E
Purchase Details
Closed on
Jan 29, 1997
Sold by
Andrews Marie T
Bought by
Kilgo Barbara S
Purchase Details
Closed on
Jan 1, 1989
Sold by
Andrews David N and Andrews Marie
Bought by
Andrews Marie T
Purchase Details
Closed on
Sep 2, 1966
Sold by
Dempsey Parker
Bought by
Andrews David N and Andrews Marie
Purchase Details
Closed on
May 6, 1966
Sold by
Rhodes Cecil G
Bought by
Dempsey Parker
Purchase Details
Closed on
Jul 26, 1955
Bought by
Rhodes Cecil G
Create a Home Valuation Report for This Property
The Home Valuation Report is an in-depth analysis detailing your home's value as well as a comparison with similar homes in the area
Home Values in the Area
Average Home Value in this Area
Purchase History
| Date | Buyer | Sale Price | Title Company |
|---|---|---|---|
| Johnson David | -- | -- | |
| Secretary Of Housing & Urban Development | -- | -- | |
| Wells Fargo Home Mortgage | $59,400 | -- | |
| Boatner Scott | -- | -- | |
| Boatner Scott | $55,000 | -- | |
| Kilgo Barbara S | $43,500 | -- | |
| Andrews Marie T | -- | -- | |
| Andrews David N | $9,000 | -- | |
| Dempsey Parker | -- | -- | |
| Rhodes Cecil G | -- | -- |
Source: Public Records
Tax History Compared to Growth
Tax History
| Year | Tax Paid | Tax Assessment Tax Assessment Total Assessment is a certain percentage of the fair market value that is determined by local assessors to be the total taxable value of land and additions on the property. | Land | Improvement |
|---|---|---|---|---|
| 2024 | $1,397 | $36,281 | $7,698 | $28,583 |
| 2023 | $646 | $25,598 | $6,843 | $18,755 |
| 2022 | $643 | $19,635 | $5,702 | $13,933 |
| 2021 | $615 | $17,892 | $5,702 | $12,190 |
| 2020 | $536 | $15,649 | $4,277 | $11,372 |
| 2019 | $502 | $14,831 | $4,277 | $10,554 |
| 2018 | $506 | $14,951 | $4,277 | $10,674 |
| 2017 | $487 | $14,425 | $4,277 | $10,148 |
| 2016 | $507 | $14,940 | $4,240 | $10,700 |
| 2015 | $504 | $14,940 | $4,240 | $10,700 |
| 2014 | $504 | $15,622 | $4,240 | $11,382 |
Source: Public Records
Map
Nearby Homes
- 15 Alexander St
- 100 Dellwood Dr NW
- 4 Homestead Cir NW
- 214 N Elm St NW
- 103 Wooten Dr SW
- 8 Leon St SW
- 40 Paris Dr SW
- 26 Jefferson Dr SW
- 16 Jefferson Dr SW
- 23 Sweetspire Dr NW
- 21 Sweetspire Dr NW
- 15 Silverbell Ln
- 209 Larkspur Ln SW
- 0 Cedartown Rd Unit 10479932
- 110 Williamson St SW
- 18 Butler Cir NW
- 43 Westwood Cir SW
- 411 Edgewood Ave NW
- 415 Edgewood Ave NW
- 409 Edgewood Ave NW
- 417 Edgewood Ave NW
- 412 Edgewood Ave NW
- 410 Edgewood Ave NW
- 407 Edgewood Ave NW
- 408 Edgewood Ave NW
- 110 Watson St NW
- 419 Edgewood Ave NW
- 414 Edgewood Ave NW
- 418 N Elm St NW
- 406 Edgewood Ave NW
- 405 Edgewood Ave NW
- 414 N Elm St NW
- 422 N Elm St NW
- 106 Watson St NW
- 0 Watson St Unit 20127823
- 0 Watson St Unit 7566143
- 0 Watson St Unit 7502543