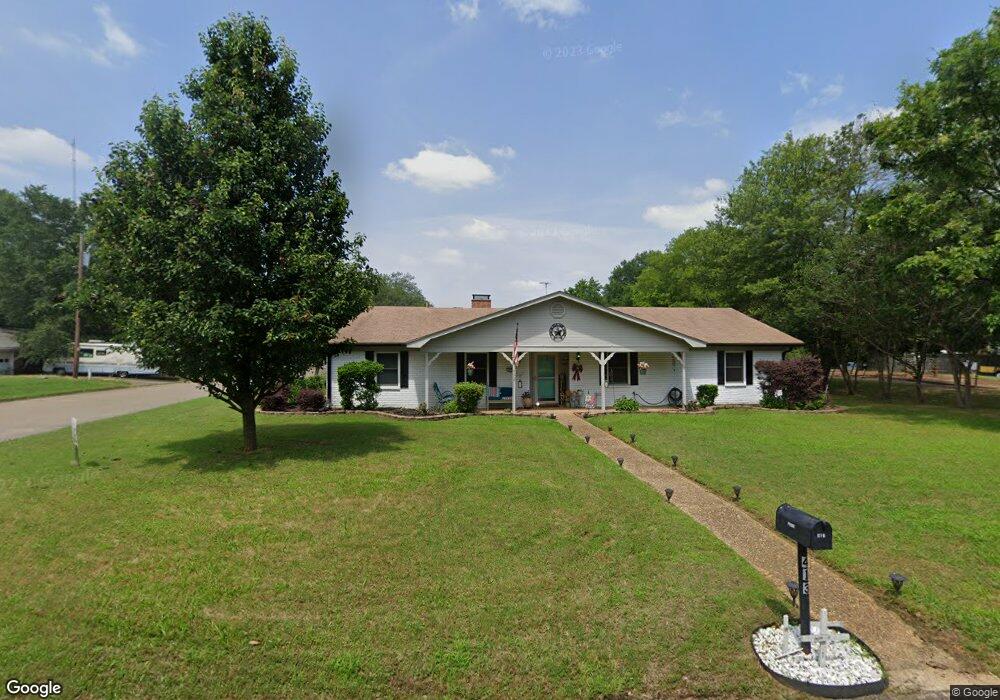
413 Edward St Longview, TX 75604
Estimated Value: $244,351 - $273,000
--
Bed
2
Baths
2,110
Sq Ft
$125/Sq Ft
Est. Value
About This Home
This home is located at 413 Edward St, Longview, TX 75604 and is currently estimated at $263,838, approximately $125 per square foot. 413 Edward St is a home located in Gregg County with nearby schools including Spring Hill Primary School, Spring Hill Intermediate School, and Spring Hill Junior High School.
Ownership History
Date
Name
Owned For
Owner Type
Purchase Details
Closed on
May 26, 2005
Sold by
Dillinger James B and Dillinger Pamela Ann Gamble
Bought by
Lanier Rickie L and Gaile Lanier R
Current Estimated Value
Home Financials for this Owner
Home Financials are based on the most recent Mortgage that was taken out on this home.
Original Mortgage
$122,927
Outstanding Balance
$63,806
Interest Rate
5.87%
Mortgage Type
VA
Estimated Equity
$200,032
Create a Home Valuation Report for This Property
The Home Valuation Report is an in-depth analysis detailing your home's value as well as a comparison with similar homes in the area
Home Values in the Area
Average Home Value in this Area
Purchase History
| Date | Buyer | Sale Price | Title Company |
|---|---|---|---|
| Lanier Rickie L | -- | Ustc |
Source: Public Records
Mortgage History
| Date | Status | Borrower | Loan Amount |
|---|---|---|---|
| Open | Lanier Rickie L | $122,927 |
Source: Public Records
Tax History Compared to Growth
Tax History
| Year | Tax Paid | Tax Assessment Tax Assessment Total Assessment is a certain percentage of the fair market value that is determined by local assessors to be the total taxable value of land and additions on the property. | Land | Improvement |
|---|---|---|---|---|
| 2025 | $1,279 | $251,300 | $9,180 | $242,120 |
| 2024 | $4,331 | $244,730 | $9,180 | $235,550 |
| 2023 | $3,944 | $231,560 | $9,180 | $222,380 |
| 2022 | $3,978 | $169,270 | $7,340 | $161,930 |
| 2021 | $3,762 | $158,410 | $7,340 | $151,070 |
| 2020 | $3,776 | $158,000 | $7,560 | $150,440 |
| 2019 | $3,840 | $157,240 | $7,560 | $149,680 |
| 2018 | $2,543 | $157,360 | $7,700 | $149,660 |
| 2017 | $3,902 | $159,750 | $7,700 | $152,050 |
| 2016 | $3,867 | $158,310 | $7,700 | $150,610 |
| 2015 | $2,630 | $160,040 | $7,700 | $152,340 |
| 2014 | -- | $158,810 | $7,700 | $151,110 |
Source: Public Records
Map
Nearby Homes