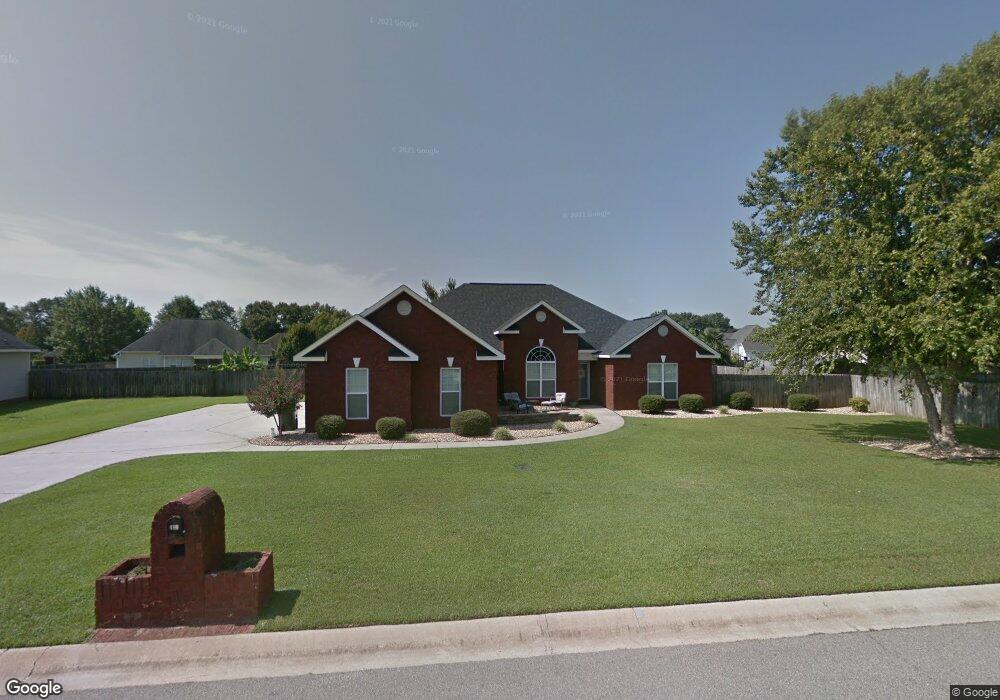
413 Erin Way Warner Robins, GA 31088
Estimated Value: $344,000 - $358,000
4
Beds
2
Baths
2,405
Sq Ft
$146/Sq Ft
Est. Value
About This Home
This home is located at 413 Erin Way, Warner Robins, GA 31088 and is currently estimated at $351,488, approximately $146 per square foot. 413 Erin Way is a home located in Houston County with nearby schools including Lake Joy Primary School, Lake Joy Elementary School, and Mossy Creek Middle School.
Ownership History
Date
Name
Owned For
Owner Type
Purchase Details
Closed on
Jun 29, 2007
Sold by
Leborious Peter J
Bought by
Leborious Peter J and Leborious Sonja R
Current Estimated Value
Home Financials for this Owner
Home Financials are based on the most recent Mortgage that was taken out on this home.
Original Mortgage
$168,300
Outstanding Balance
$103,311
Interest Rate
6.16%
Mortgage Type
New Conventional
Estimated Equity
$248,177
Purchase Details
Closed on
May 13, 2005
Sold by
Bibb Charles
Bought by
Lee David S
Home Financials for this Owner
Home Financials are based on the most recent Mortgage that was taken out on this home.
Original Mortgage
$205,567
Interest Rate
5.98%
Mortgage Type
VA
Purchase Details
Closed on
Feb 9, 2004
Sold by
Sctc Development Llc
Bought by
Bibb Charles
Purchase Details
Closed on
Oct 10, 2003
Sold by
Ncw Inc
Bought by
Sctc Development Llc
Create a Home Valuation Report for This Property
The Home Valuation Report is an in-depth analysis detailing your home's value as well as a comparison with similar homes in the area
Home Values in the Area
Average Home Value in this Area
Purchase History
| Date | Buyer | Sale Price | Title Company |
|---|---|---|---|
| Leborious Peter J | -- | None Available | |
| Leborious Peter J | $213,000 | None Available | |
| Lee David S | $199,000 | None Available | |
| Bibb Charles | $27,000 | -- | |
| Sctc Development Llc | $27,000 | -- |
Source: Public Records
Mortgage History
| Date | Status | Borrower | Loan Amount |
|---|---|---|---|
| Open | Leborious Peter J | $168,300 | |
| Previous Owner | Lee David S | $205,567 |
Source: Public Records
Tax History Compared to Growth
Tax History
| Year | Tax Paid | Tax Assessment Tax Assessment Total Assessment is a certain percentage of the fair market value that is determined by local assessors to be the total taxable value of land and additions on the property. | Land | Improvement |
|---|---|---|---|---|
| 2024 | $3,840 | $118,720 | $14,000 | $104,720 |
| 2023 | $3,238 | $99,600 | $14,000 | $85,600 |
| 2022 | $2,153 | $95,640 | $14,000 | $81,640 |
| 2021 | $1,994 | $88,240 | $14,000 | $74,240 |
| 2020 | $1,924 | $84,800 | $14,000 | $70,800 |
| 2019 | $1,924 | $84,800 | $14,000 | $70,800 |
| 2018 | $1,803 | $79,600 | $11,200 | $68,400 |
| 2017 | $1,805 | $79,600 | $11,200 | $68,400 |
| 2016 | $1,807 | $79,600 | $11,200 | $68,400 |
| 2015 | -- | $79,600 | $11,200 | $68,400 |
| 2014 | -- | $79,600 | $11,200 | $68,400 |
| 2013 | -- | $79,600 | $11,200 | $68,400 |
Source: Public Records
Map
Nearby Homes