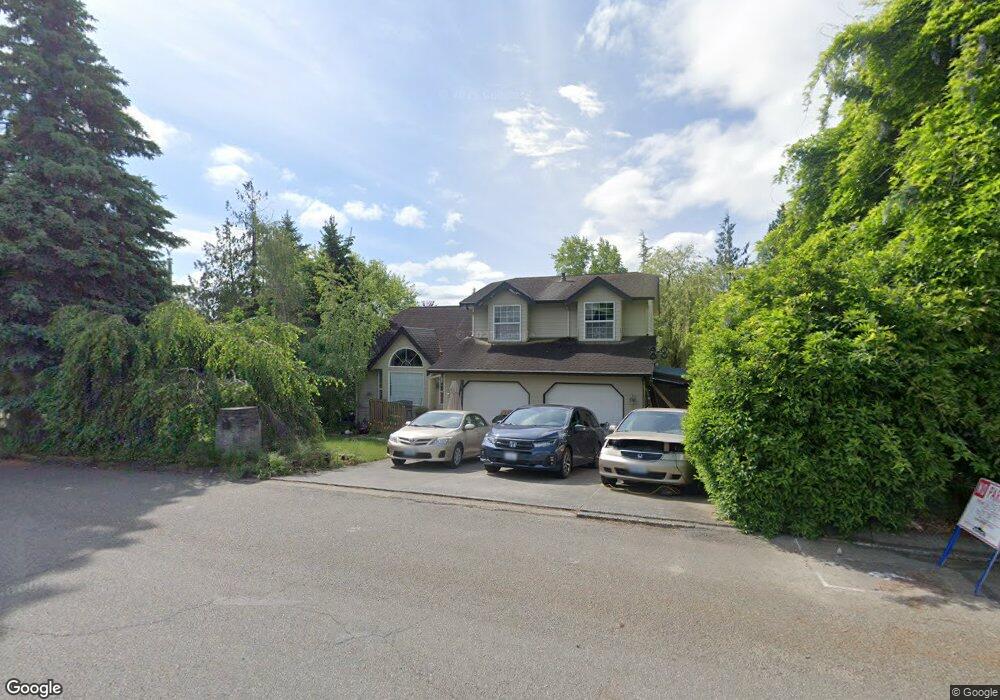
413 Fish Trap Way Lynden, WA 98264
Estimated Value: $648,000 - $687,000
3
Beds
4
Baths
2,600
Sq Ft
$258/Sq Ft
Est. Value
About This Home
This home is located at 413 Fish Trap Way, Lynden, WA 98264 and is currently estimated at $670,841, approximately $258 per square foot. 413 Fish Trap Way is a home located in Whatcom County with nearby schools including Lynden High School, Lynden Christian School, and Lynden Christian Schools: Administration.
Ownership History
Date
Name
Owned For
Owner Type
Purchase Details
Closed on
Jul 11, 2008
Sold by
Shuler Douglas D and Shuler Jennifer E
Bought by
Rudy Steven and Rudy Rena
Current Estimated Value
Purchase Details
Closed on
Nov 15, 2002
Sold by
Kaiser Gary W and Kaiser Kathryn T
Bought by
Shuler Douglas D and Shuler Jennifer E
Home Financials for this Owner
Home Financials are based on the most recent Mortgage that was taken out on this home.
Original Mortgage
$187,200
Interest Rate
5.61%
Mortgage Type
Purchase Money Mortgage
Purchase Details
Closed on
Mar 24, 2000
Sold by
Ellis Douglas A and Ellis Barbara
Bought by
Kaiser Gary W and Kaiser Kathryn T
Home Financials for this Owner
Home Financials are based on the most recent Mortgage that was taken out on this home.
Original Mortgage
$151,000
Interest Rate
8.38%
Create a Home Valuation Report for This Property
The Home Valuation Report is an in-depth analysis detailing your home's value as well as a comparison with similar homes in the area
Home Values in the Area
Average Home Value in this Area
Purchase History
| Date | Buyer | Sale Price | Title Company |
|---|---|---|---|
| Rudy Steven | $286,280 | Chicago Title Insurance | |
| Shuler Douglas D | $247,898 | Chicago Title Insurance | |
| Kaiser Gary W | $200,000 | Chicago Title Insurance Co |
Source: Public Records
Mortgage History
| Date | Status | Borrower | Loan Amount |
|---|---|---|---|
| Previous Owner | Shuler Douglas D | $187,200 | |
| Previous Owner | Kaiser Gary W | $151,000 | |
| Closed | Shuler Douglas D | $46,800 |
Source: Public Records
Tax History
| Year | Tax Paid | Tax Assessment Tax Assessment Total Assessment is a certain percentage of the fair market value that is determined by local assessors to be the total taxable value of land and additions on the property. | Land | Improvement |
|---|---|---|---|---|
| 2025 | $4,560 | $619,582 | $259,184 | $360,398 |
| 2024 | $4,272 | $601,919 | $230,375 | $371,544 |
| 2023 | $4,272 | $594,754 | $237,500 | $357,254 |
| 2022 | $4,188 | $550,155 | $163,813 | $386,342 |
| 2021 | $4,108 | $454,668 | $135,381 | $319,287 |
| 2020 | $3,598 | $405,964 | $120,879 | $285,085 |
| 2019 | $3,201 | $372,315 | $110,987 | $261,328 |
| 2018 | $3,499 | $339,554 | $101,105 | $238,449 |
| 2017 | $3,154 | $304,778 | $90,750 | $214,028 |
| 2016 | $2,975 | $292,278 | $82,500 | $209,778 |
| 2015 | $2,637 | $274,164 | $79,350 | $194,814 |
| 2014 | -- | $264,876 | $76,650 | $188,226 |
| 2013 | -- | $263,226 | $75,000 | $188,226 |
Source: Public Records
Map
Nearby Homes
- 1656 Liberty St Unit 101
- 108 Fairside Dr Unit 1
- 1416 Front St
- 1510 E St
- 8424 Double Ditch Rd
- 410 10th St
- 0 Guide Meridian Unit NWM2369980
- 919 Liberty St
- 1882 Front St Unit B404
- 1882 Front St Unit B302
- 801 19th St
- 208 9th St
- 1774 Farmview Terrace
- 915 Front St
- 1710 Farmview Terrace
- 735 Ivy St
- 902 Captain Bay Ct
- 7008 Guide Meridian Rd
- 2010 Front St Unit 33
- 805 Cedar Dr
- 415 Fish Trap Way
- 0 Clark Ct
- 416 Clark Ct
- 417 Fish Trap Way
- 412 Clark Ct
- 402 17th St
- 1680 Liberty St Unit 202
- 1680 Liberty St Unit 201
- 1680 Liberty St Unit 103
- 1680 Liberty St Unit 102
- 1680 Liberty St Unit 101
- 1680 Liberty St Unit A203
- 1680 Liberty St Unit 203
- 419 Fish Trap Way
- 414 Clark Ct
- 405 17th St
- 404 17th St
- 424 Clark Ct
- 425 Fish Trap Way
- 406 17th St
Your Personal Tour Guide
Ask me questions while you tour the home.