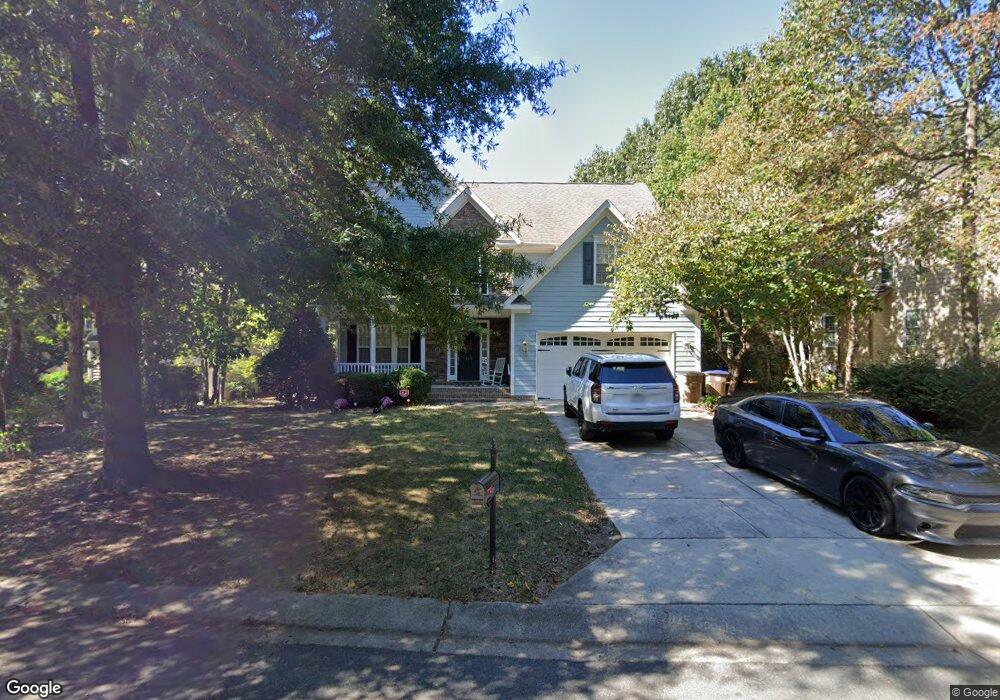
413 Gambit Cir Wake Forest, NC 27587
Estimated Value: $747,000 - $859,000
6
Beds
7
Baths
5,030
Sq Ft
$159/Sq Ft
Est. Value
About This Home
This home is located at 413 Gambit Cir, Wake Forest, NC 27587 and is currently estimated at $798,312, approximately $158 per square foot. 413 Gambit Cir is a home located in Wake County with nearby schools including Richland Creek Elementary School, Wake Forest-Rolesville Middle School, and Wake Forest High School.
Ownership History
Date
Name
Owned For
Owner Type
Purchase Details
Closed on
May 20, 2015
Sold by
Oncy Robert Michael and Oncy Sharonn V
Bought by
Barners Lauther E and Barners Sarah L
Current Estimated Value
Home Financials for this Owner
Home Financials are based on the most recent Mortgage that was taken out on this home.
Original Mortgage
$416,948
Outstanding Balance
$322,016
Interest Rate
3.75%
Mortgage Type
VA
Estimated Equity
$476,296
Purchase Details
Closed on
Jun 7, 2007
Sold by
H J Morris Construction Inc
Bought by
Oney Robert Michael and Oney Sharon
Home Financials for this Owner
Home Financials are based on the most recent Mortgage that was taken out on this home.
Original Mortgage
$268,188
Interest Rate
6.16%
Mortgage Type
Purchase Money Mortgage
Purchase Details
Closed on
Oct 26, 2006
Sold by
Contentnea Creek Development Co
Bought by
Hj Morris Construction Inc
Create a Home Valuation Report for This Property
The Home Valuation Report is an in-depth analysis detailing your home's value as well as a comparison with similar homes in the area
Home Values in the Area
Average Home Value in this Area
Purchase History
| Date | Buyer | Sale Price | Title Company |
|---|---|---|---|
| Barners Lauther E | $475,000 | None Available | |
| Oney Robert Michael | $335,500 | None Available | |
| Hj Morris Construction Inc | $170,000 | None Available |
Source: Public Records
Mortgage History
| Date | Status | Borrower | Loan Amount |
|---|---|---|---|
| Open | Barners Lauther E | $416,948 | |
| Previous Owner | Oney Robert Michael | $268,188 | |
| Previous Owner | Oney Robert Michael | $50,285 |
Source: Public Records
Tax History
| Year | Tax Paid | Tax Assessment Tax Assessment Total Assessment is a certain percentage of the fair market value that is determined by local assessors to be the total taxable value of land and additions on the property. | Land | Improvement |
|---|---|---|---|---|
| 2025 | $6,800 | $710,581 | $130,000 | $580,581 |
| 2024 | $6,884 | $710,581 | $130,000 | $580,581 |
Source: Public Records
Map
Nearby Homes
- 520 Checkmate Cir
- 1401 Endgame Ct
- 1329 Endgame Ct
- 1513 Trap Ct
- 501 Kings Glen Way
- 332 Kings Glen Way
- 501 Morning Glade St
- Ashford Plan at Radford Glen
- Newport Plan at Radford Glen
- Andrews Plan at Radford Glen
- Bedford Plan at Radford Glen
- Wayland Plan at Radford Glen
- Sheridan Plan at Radford Glen
- 504 Sun Meadow Dr
- 617 Dixon House Ct
- 1329 Martin Creek Dr
- 1632 Sterling Lake Dr
- 621 Sun Meadow Dr
- 123 Stone Park Dr
- 1121 Touchstone Way
- 417 Gambit Cir
- 409 Gambit Cir
- 421 Gambit Cir
- 709 Opposition Way
- 709 Opposition Way Unit 152
- 405 Gambit Cir
- 713 Opposition Way
- 705 Opposition Way
- 705 Opposition Way Unit 153
- 717 Opposition Way
- 412 Gambit Cir
- 416 Gambit Cir
- 425 Gambit Cir
- 408 Gambit Cir
- 420 Gambit Cir
- 721 Opposition Way
- 400 Gambit Cir
- 701 Opposition Way Unit 154
- 701 Opposition Way
- 404 Gambit Cir
Your Personal Tour Guide
Ask me questions while you tour the home.