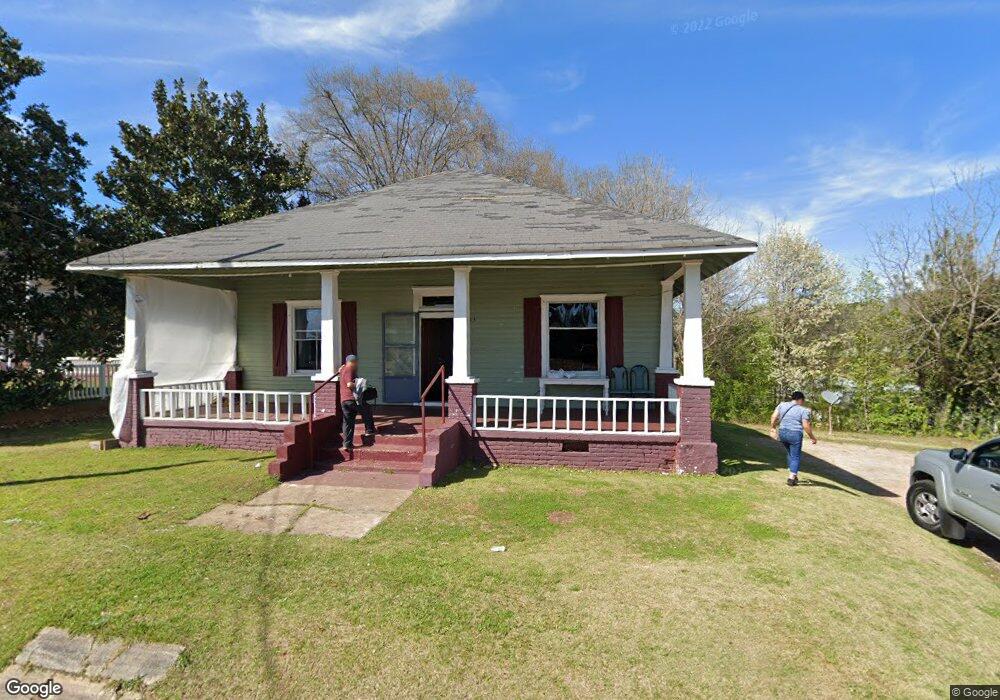
413 Hines St Lagrange, GA 30241
Estimated Value: $69,000 - $120,000
3
Beds
1
Bath
1,352
Sq Ft
$77/Sq Ft
Est. Value
About This Home
This home is located at 413 Hines St, Lagrange, GA 30241 and is currently estimated at $104,034, approximately $76 per square foot. 413 Hines St is a home located in Troup County with nearby schools including Hollis Hand Elementary School, Franklin Forest Elementary School, and Ethel W. Kight Elementary School.
Ownership History
Date
Name
Owned For
Owner Type
Purchase Details
Closed on
Mar 9, 2004
Sold by
Steven B Cosper
Bought by
Cosper Realty Llc
Current Estimated Value
Purchase Details
Closed on
Mar 28, 1996
Sold by
Perry D Bradley
Bought by
Steven B Cosper
Purchase Details
Closed on
Jul 24, 1995
Sold by
Sec Hud
Bought by
Perry D Bradley
Purchase Details
Closed on
Feb 7, 1995
Sold by
Real Estate Holding Inc
Bought by
Sec Hud
Purchase Details
Closed on
Feb 1, 1995
Sold by
Jefferson & Rose Fannin By Aty
Bought by
Real Estate Holding Inc
Purchase Details
Closed on
May 16, 1979
Sold by
Wallace C M
Bought by
Jefferson & Rose Fannin By Aty
Purchase Details
Closed on
Apr 14, 1977
Sold by
Tanner R E
Bought by
Wallace C M
Purchase Details
Closed on
Jul 15, 1976
Sold by
Tanner R E
Bought by
Tanner R E
Purchase Details
Closed on
Mar 7, 1975
Sold by
Carter Buford and Carter Rosalind
Bought by
Tanner R E
Purchase Details
Closed on
Jan 1, 1963
Sold by
Lipham W H
Bought by
Carter Buford and Carter Rosalind
Create a Home Valuation Report for This Property
The Home Valuation Report is an in-depth analysis detailing your home's value as well as a comparison with similar homes in the area
Purchase History
| Date | Buyer | Sale Price | Title Company |
|---|---|---|---|
| Cosper Realty Llc | -- | -- | |
| Steven B Cosper | $34,000 | -- | |
| Perry D Bradley | -- | -- | |
| Sec Hud | $10,700 | -- | |
| Real Estate Holding Inc | $10,700 | -- | |
| Jefferson & Rose Fannin By Aty | $18,000 | -- | |
| Wallace C M | $12,000 | -- | |
| Tanner R E | -- | -- | |
| Tanner R E | -- | -- | |
| Carter Buford | -- | -- |
Source: Public Records
Tax History
| Year | Tax Paid | Tax Assessment Tax Assessment Total Assessment is a certain percentage of the fair market value that is determined by local assessors to be the total taxable value of land and additions on the property. | Land | Improvement |
|---|---|---|---|---|
| 2025 | $933 | $34,200 | $10,840 | $23,360 |
| 2024 | $900 | $33,000 | $10,840 | $22,160 |
| 2023 | $772 | $28,320 | $10,840 | $17,480 |
| 2022 | $747 | $26,760 | $10,840 | $15,920 |
| 2021 | $890 | $29,520 | $10,840 | $18,680 |
| 2020 | $890 | $29,520 | $10,840 | $18,680 |
| 2019 | $831 | $27,560 | $10,840 | $16,720 |
| 2018 | $817 | $27,088 | $10,368 | $16,720 |
| 2017 | $817 | $27,088 | $10,368 | $16,720 |
| 2016 | $801 | $26,556 | $10,368 | $16,188 |
| 2015 | $802 | $26,556 | $10,368 | $16,188 |
| 2014 | $826 | $27,310 | $10,368 | $16,942 |
| 2013 | -- | $28,275 | $10,368 | $17,907 |
Source: Public Records
Map
Nearby Homes
Your Personal Tour Guide
Ask me questions while you tour the home.