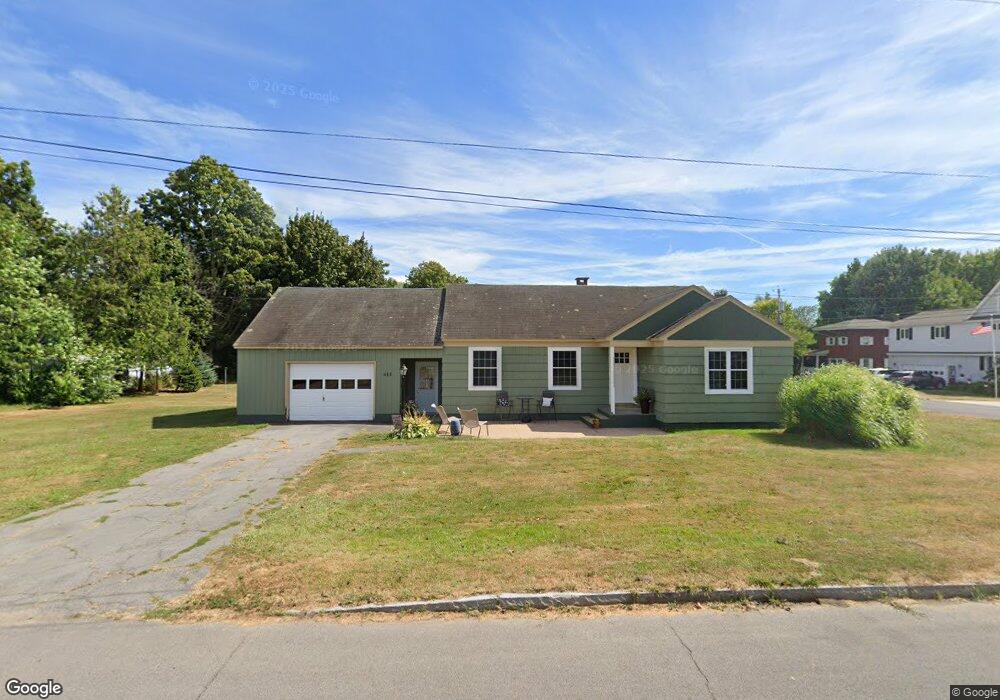
413 Kellogg St Fulton, NY 13069
Estimated Value: $118,000 - $147,407
3
Beds
1
Bath
958
Sq Ft
$142/Sq Ft
Est. Value
About This Home
This home is located at 413 Kellogg St, Fulton, NY 13069 and is currently estimated at $135,852, approximately $141 per square foot. 413 Kellogg St is a home located in Oswego County with nearby schools including G Ray Bodley High School.
Ownership History
Date
Name
Owned For
Owner Type
Purchase Details
Closed on
May 20, 2025
Sold by
Reiter Sharon E and Estate Of Vincent J Valelunga
Bought by
Noel Haley E
Current Estimated Value
Home Financials for this Owner
Home Financials are based on the most recent Mortgage that was taken out on this home.
Original Mortgage
$109,020
Outstanding Balance
$108,633
Interest Rate
6.64%
Mortgage Type
New Conventional
Estimated Equity
$27,219
Purchase Details
Closed on
Jan 3, 2004
Sold by
Sorkness Christine A
Bought by
Valelunga Vincent
Create a Home Valuation Report for This Property
The Home Valuation Report is an in-depth analysis detailing your home's value as well as a comparison with similar homes in the area
Home Values in the Area
Average Home Value in this Area
Purchase History
| Date | Buyer | Sale Price | Title Company |
|---|---|---|---|
| Noel Haley E | $124,000 | Cny Abstract & Ttl Svcs Inc | |
| Valelunga Vincent | $62,000 | -- | |
| Valelunga Vincent | $62,000 | -- |
Source: Public Records
Mortgage History
| Date | Status | Borrower | Loan Amount |
|---|---|---|---|
| Open | Noel Haley E | $109,020 |
Source: Public Records
Tax History Compared to Growth
Tax History
| Year | Tax Paid | Tax Assessment Tax Assessment Total Assessment is a certain percentage of the fair market value that is determined by local assessors to be the total taxable value of land and additions on the property. | Land | Improvement |
|---|---|---|---|---|
| 2024 | $6,607 | $95,000 | $7,300 | $87,700 |
| 2023 | $4,618 | $95,000 | $7,300 | $87,700 |
| 2022 | $4,138 | $95,000 | $7,300 | $87,700 |
| 2021 | $3,916 | $65,100 | $9,700 | $55,400 |
| 2020 | $3,867 | $65,100 | $9,700 | $55,400 |
| 2019 | $3,803 | $65,100 | $9,700 | $55,400 |
| 2018 | $3,803 | $65,100 | $9,700 | $55,400 |
| 2017 | $3,781 | $65,100 | $9,700 | $55,400 |
| 2016 | $3,846 | $65,100 | $9,700 | $55,400 |
| 2015 | -- | $65,100 | $9,700 | $55,400 |
| 2014 | -- | $65,100 | $9,700 | $55,400 |
Source: Public Records
Map
Nearby Homes