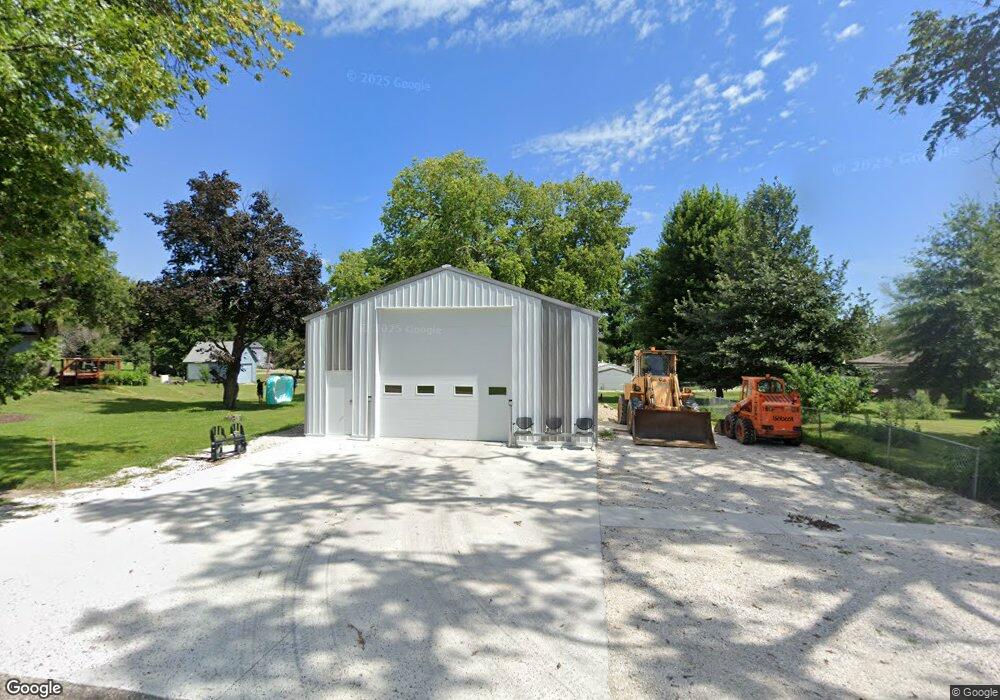
413 Maple St Deloit, IA 51441
Estimated Value: $31,000 - $31,002
Studio
--
Bath
--
Sq Ft
9,017
Sq Ft Lot
About This Home
This home is located at 413 Maple St, Deloit, IA 51441 and is currently estimated at $31,001. 413 Maple St is a home located in Crawford County with nearby schools including Denison Elementary School, Broadway Elementary School, and Denison Middle School.
Ownership History
Date
Name
Owned For
Owner Type
Purchase Details
Closed on
Feb 17, 2025
Sold by
Hartwig Shannon
Bought by
Hill Anthony
Current Estimated Value
Home Financials for this Owner
Home Financials are based on the most recent Mortgage that was taken out on this home.
Original Mortgage
$29,500
Outstanding Balance
$29,325
Interest Rate
6.93%
Mortgage Type
Credit Line Revolving
Estimated Equity
$1,676
Purchase Details
Closed on
Dec 10, 2024
Sold by
S & S Construction Company Llc
Bought by
Hartwig Shannon
Purchase Details
Closed on
May 11, 2021
Sold by
Steinkuehler James R
Bought by
S & S Construction Company Llc
Create a Home Valuation Report for This Property
The Home Valuation Report is an in-depth analysis detailing your home's value as well as a comparison with similar homes in the area
Purchase History
| Date | Buyer | Sale Price | Title Company |
|---|---|---|---|
| Hill Anthony | $30,500 | None Listed On Document | |
| Hartwig Shannon | $75,500 | None Listed On Document | |
| S & S Construction Company Llc | $48,000 | None Listed On Document |
Source: Public Records
Mortgage History
| Date | Status | Borrower | Loan Amount |
|---|---|---|---|
| Open | Hill Anthony | $29,500 |
Source: Public Records
Tax History
| Year | Tax Paid | Tax Assessment Tax Assessment Total Assessment is a certain percentage of the fair market value that is determined by local assessors to be the total taxable value of land and additions on the property. | Land | Improvement |
|---|---|---|---|---|
| 2025 | $280 | $18,660 | $3,370 | $15,290 |
| 2024 | $280 | $19,600 | $3,370 | $16,230 |
| 2023 | $234 | $19,600 | $3,370 | $16,230 |
| 2022 | $234 | $14,740 | $2,450 | $12,290 |
| 2021 | $238 | $14,740 | $2,450 | $12,290 |
| 2020 | $270 | $14,240 | $2,450 | $11,790 |
| 2019 | $284 | $14,350 | $2,450 | $11,900 |
| 2018 | $274 | $14,350 | $2,450 | $11,900 |
| 2017 | $274 | $14,350 | $2,450 | $11,900 |
| 2016 | $264 | $13,830 | $0 | $0 |
| 2015 | $264 | $14,110 | $0 | $0 |
| 2014 | $264 | $14,110 | $0 | $0 |
Source: Public Records
Map
Nearby Homes
- 401 Kane St
- 1511 Highway 39
- 1402 Settlers Ln
- 2301 Frontier Rd
- 1228 N 16th St
- 3261 F Ave
- 1014 Oakpark Blvd
- 1000 Ridge Rd
- 1571 330th St
- 1568 330th St
- 812 Urbandale Dr
- 609 N 24th St
- 818 Charles St
- 2002 Ridgeway Dr
- 613 N 20th St
- 2021 Ridgeway Dr
- 1720 6th Ave N
- 1803 4th Ave N
- 120 N 24th St
- 1404 4th Ave N
Your Personal Tour Guide
Ask me questions while you tour the home.