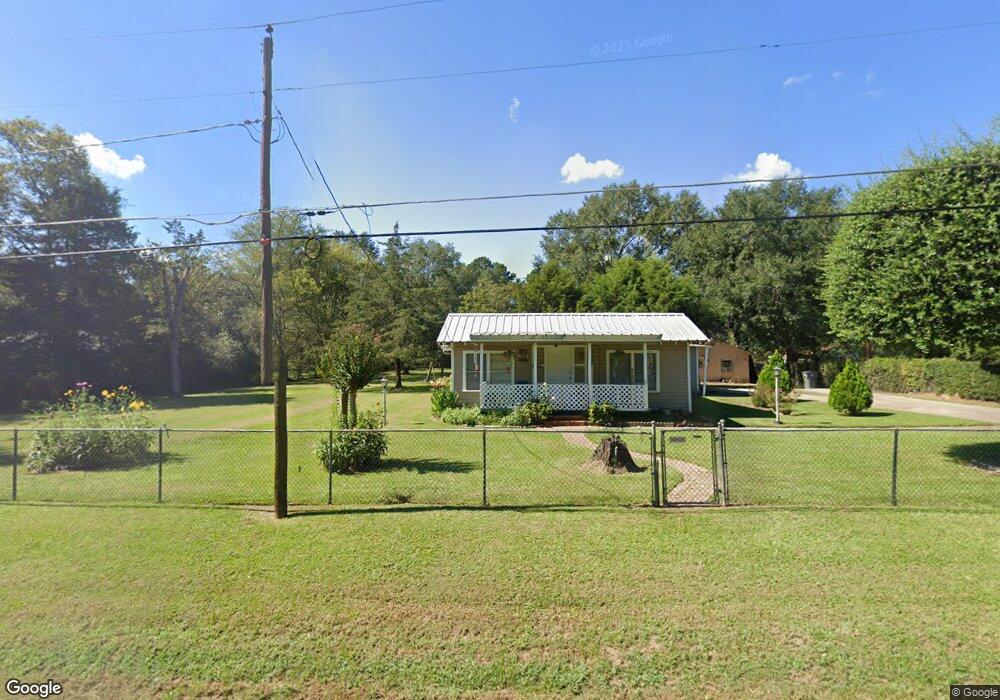
413 McHale St Lufkin, TX 75901
Estimated Value: $90,000 - $181,000
3
Beds
2
Baths
1,800
Sq Ft
$76/Sq Ft
Est. Value
About This Home
This home is located at 413 McHale St, Lufkin, TX 75901 and is currently estimated at $137,509, approximately $76 per square foot. 413 McHale St is a home located in Angelina County with nearby schools including Herty Primary School, Coston Elementary School, and Lufkin Middle School.
Ownership History
Date
Name
Owned For
Owner Type
Purchase Details
Closed on
Mar 15, 2010
Sold by
Pearson Financial Corp
Bought by
Lara Salvador
Current Estimated Value
Home Financials for this Owner
Home Financials are based on the most recent Mortgage that was taken out on this home.
Original Mortgage
$53,900
Interest Rate
4.73%
Mortgage Type
Purchase Money Mortgage
Purchase Details
Closed on
Feb 9, 2010
Sold by
Jones Connie B
Bought by
Pearson Financial Corp P S Pension Plan
Home Financials for this Owner
Home Financials are based on the most recent Mortgage that was taken out on this home.
Original Mortgage
$53,900
Interest Rate
4.73%
Mortgage Type
Purchase Money Mortgage
Purchase Details
Closed on
Mar 15, 2007
Sold by
Real Estate Results Inc
Bought by
Jones Connie B
Home Financials for this Owner
Home Financials are based on the most recent Mortgage that was taken out on this home.
Original Mortgage
$44,900
Interest Rate
6.71%
Mortgage Type
Purchase Money Mortgage
Create a Home Valuation Report for This Property
The Home Valuation Report is an in-depth analysis detailing your home's value as well as a comparison with similar homes in the area
Purchase History
| Date | Buyer | Sale Price | Title Company |
|---|---|---|---|
| Lara Salvador | $53,900 | None Available | |
| Pearson Financial Corp P S Pension Plan | $44,900 | None Available | |
| Jones Connie B | $44,900 | None Available |
Source: Public Records
Mortgage History
| Date | Status | Borrower | Loan Amount |
|---|---|---|---|
| Previous Owner | Lara Salvador | $53,900 | |
| Previous Owner | Jones Connie B | $44,900 |
Source: Public Records
Tax History
| Year | Tax Paid | Tax Assessment Tax Assessment Total Assessment is a certain percentage of the fair market value that is determined by local assessors to be the total taxable value of land and additions on the property. | Land | Improvement |
|---|---|---|---|---|
| 2025 | $2,189 | $118,750 | $21,100 | $97,650 |
| 2024 | $1,990 | $104,010 | $21,100 | $82,910 |
| 2023 | $1,720 | $102,420 | $21,100 | $81,320 |
| 2022 | $1,792 | $80,070 | $8,800 | $71,270 |
| 2021 | $1,762 | $73,980 | $8,800 | $65,180 |
| 2020 | $1,598 | $65,030 | $6,900 | $58,130 |
| 2019 | $1,603 | $61,670 | $6,900 | $54,770 |
| 2018 | $1,061 | $59,650 | $6,900 | $52,750 |
| 2017 | $1,061 | $57,210 | $6,900 | $50,310 |
| 2016 | $1,342 | $56,280 | $6,900 | $49,380 |
| 2015 | $811 | $56,280 | $6,900 | $49,380 |
| 2014 | $811 | $52,590 | $6,900 | $45,690 |
Source: Public Records
Map
Nearby Homes
- 706 Neches St
- 108 Home Ave
- 2915 Freeman St
- 0 N Highway 69
- 2549 N Highway 69
- 4344 N Highway 69
- Tract 189 N Highway 69
- 2232 N Medford Dr
- 1603 Atkinson Dr
- 2401 Paul Ave
- Tract 48 Shady Pine St
- Tract 50 Shady Pine St
- Tract 49 Shady Pine St
- 3108 E Lufkin Ave
- 801 Shermell St
- 504 John Kolb Rd
- 1914 Pineburr St
- 206 Shady Pine St
- 2122 Paul Ave
- 2105 Paul Ave
- LOT 6-11,12.1,A McHale St
- 407 McHale St
- 503 McHale St
- 3202 Nerren Ave
- 3119 Nerren Ave
- 502 McHale St
- 408 McHale St
- 403 McHale St
- 505 McHale St
- 3117 Nerren Ave
- 3112 Nerren Ave
- 3112 Nerren Ave
- 3206 Nerren Ave
- 3115 Nerren Ave
- 503 Dominy St
- 601 McHale St
- 3208 Edwards Ave
- 3210 Edwards Ave
- 3212 Edwards Ave
- 603 McHale St
Your Personal Tour Guide
Ask me questions while you tour the home.