Estimated Value: $267,181 - $287,000
3
Beds
2
Baths
1,512
Sq Ft
$186/Sq Ft
Est. Value
About This Home
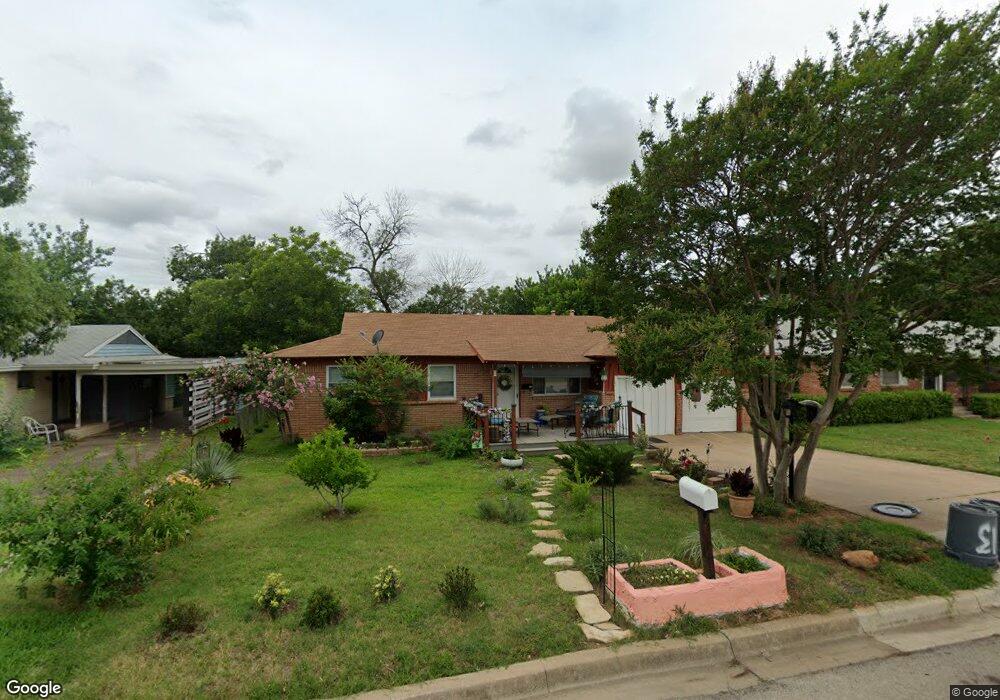
This home is located at 413 Myrtle Dr, Hurst, TX 76053 and is currently estimated at $281,295, approximately $186 per square foot. 413 Myrtle Dr is a home located in Tarrant County with nearby schools including West Hurst Elementary School, Hurst J High School, and L.D. Bell High School.
Ownership History
Date
Name
Owned For
Owner Type
Purchase Details
Closed on
Oct 11, 2022
Sold by
Betty Carol Stclair Revocable Living Tru
Bought by
St Clair Betty Carol
Current Estimated Value
Purchase Details
Closed on
May 24, 1996
Sold by
Stclair Gerald and Stclair Gerald S
Bought by
Stclair Gerald and Stclair Betty C
Home Financials for this Owner
Home Financials are based on the most recent Mortgage that was taken out on this home.
Original Mortgage
$45,090
Interest Rate
9%
Mortgage Type
VA
Create a Home Valuation Report for This Property
The Home Valuation Report is an in-depth analysis detailing your home's value as well as a comparison with similar homes in the area
Home Values in the Area
Average Home Value in this Area
Purchase History
| Date | Buyer | Sale Price | Title Company |
|---|---|---|---|
| St Clair Betty Carol | -- | -- | |
| St Clair Betty Carol | -- | -- | |
| Stclair Gerald | -- | -- |
Source: Public Records
Mortgage History
| Date | Status | Borrower | Loan Amount |
|---|---|---|---|
| Previous Owner | Stclair Gerald | $45,090 |
Source: Public Records
Tax History
| Year | Tax Paid | Tax Assessment Tax Assessment Total Assessment is a certain percentage of the fair market value that is determined by local assessors to be the total taxable value of land and additions on the property. | Land | Improvement |
|---|---|---|---|---|
| 2025 | $623 | $255,351 | $50,000 | $205,351 |
| 2024 | $623 | $255,351 | $50,000 | $205,351 |
| 2023 | $3,878 | $236,053 | $35,000 | $201,053 |
| 2022 | $4,052 | $203,369 | $35,000 | $168,369 |
| 2021 | $3,858 | $182,561 | $35,000 | $147,561 |
| 2020 | $3,499 | $160,741 | $35,000 | $125,741 |
| 2019 | $3,236 | $159,116 | $35,000 | $124,116 |
| 2018 | $1,164 | $120,189 | $19,000 | $101,189 |
| 2017 | $2,765 | $126,300 | $19,000 | $107,300 |
| 2016 | $2,514 | $131,083 | $19,000 | $112,083 |
| 2015 | $1,233 | $90,300 | $13,500 | $76,800 |
| 2014 | $1,233 | $90,300 | $13,500 | $76,800 |
Source: Public Records
Map
Nearby Homes
- 608 W Redbud Dr
- 512 Shadowbrook Ln
- 408 Simmons Dr
- 416 Simmons Dr
- 637 Post Oak Dr
- 528 Buena Vista Dr
- 709 Hurstview Dr
- 408 Harrison Ln
- 47 Donald Ct
- 756 Briarwood Ln
- 758 Briarwood Ln
- 231 Elm St
- 712 Pine St
- 780 Betty Ln
- 205 Corinna Ct
- 108 Donald Dr
- 800 Treadwell Ct Unit 800B
- 552 Norwood Dr
- 424 Holder Dr
- 808 Betty Ct
Your Personal Tour Guide
Ask me questions while you tour the home.