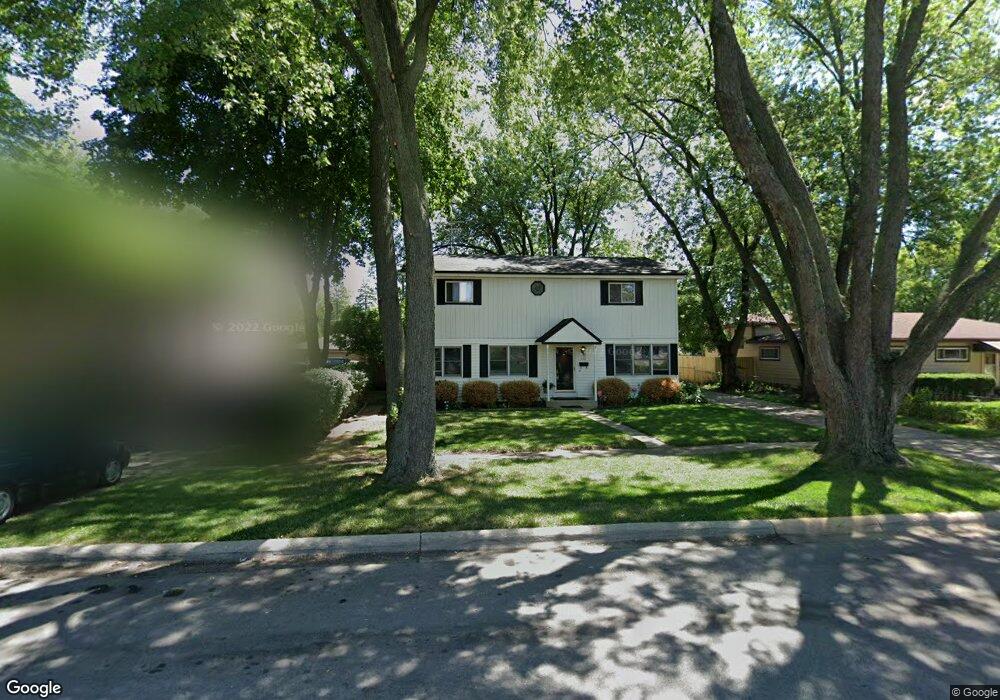
413 N 3rd Ave Villa Park, IL 60181
Estimated Value: $344,000 - $477,000
3
Beds
--
Bath
2,146
Sq Ft
$199/Sq Ft
Est. Value
About This Home
This home is located at 413 N 3rd Ave, Villa Park, IL 60181 and is currently estimated at $426,449, approximately $198 per square foot. 413 N 3rd Ave is a home located in DuPage County with nearby schools including Schafer Elementary School, Jefferson Middle School, and Willowbrook High School.
Ownership History
Date
Name
Owned For
Owner Type
Purchase Details
Closed on
Sep 29, 2004
Sold by
West Suburban Bank
Bought by
Peoples Leon and Peoples Brenda
Current Estimated Value
Home Financials for this Owner
Home Financials are based on the most recent Mortgage that was taken out on this home.
Original Mortgage
$200,000
Outstanding Balance
$100,111
Interest Rate
5.93%
Mortgage Type
Purchase Money Mortgage
Estimated Equity
$326,338
Purchase Details
Closed on
Mar 2, 2001
Sold by
West Suburban Bank
Bought by
Tiberi Charles and Tiberi Patricia
Home Financials for this Owner
Home Financials are based on the most recent Mortgage that was taken out on this home.
Original Mortgage
$85,000
Interest Rate
7.13%
Mortgage Type
Seller Take Back
Purchase Details
Closed on
Oct 2, 1994
Sold by
Villa Park Trust & Svgs Bank
Bought by
Tiberi Charles F and Tiberi Patricia A
Home Financials for this Owner
Home Financials are based on the most recent Mortgage that was taken out on this home.
Original Mortgage
$90,400
Interest Rate
8.91%
Create a Home Valuation Report for This Property
The Home Valuation Report is an in-depth analysis detailing your home's value as well as a comparison with similar homes in the area
Home Values in the Area
Average Home Value in this Area
Purchase History
| Date | Buyer | Sale Price | Title Company |
|---|---|---|---|
| Peoples Leon | $250,000 | Ticor Title | |
| Tiberi Charles | -- | Law Title Pick Up | |
| Tiberi Charles F | $113,000 | -- |
Source: Public Records
Mortgage History
| Date | Status | Borrower | Loan Amount |
|---|---|---|---|
| Open | Peoples Leon | $200,000 | |
| Previous Owner | Tiberi Charles | $85,000 | |
| Previous Owner | Tiberi Charles F | $90,400 | |
| Closed | Peoples Leon | $50,000 |
Source: Public Records
Tax History Compared to Growth
Tax History
| Year | Tax Paid | Tax Assessment Tax Assessment Total Assessment is a certain percentage of the fair market value that is determined by local assessors to be the total taxable value of land and additions on the property. | Land | Improvement |
|---|---|---|---|---|
| 2024 | $5,477 | $124,058 | $15,345 | $108,713 |
| 2023 | $5,674 | $114,720 | $14,190 | $100,530 |
| 2022 | $6,023 | $110,280 | $13,640 | $96,640 |
| 2021 | $5,934 | $107,540 | $13,300 | $94,240 |
| 2020 | $5,931 | $105,180 | $13,010 | $92,170 |
| 2019 | $5,844 | $100,000 | $12,370 | $87,630 |
| 2018 | $6,222 | $88,460 | $10,940 | $77,520 |
| 2017 | $6,051 | $84,290 | $10,420 | $73,870 |
| 2016 | $5,854 | $79,410 | $9,820 | $69,590 |
| 2015 | $6,193 | $73,980 | $9,150 | $64,830 |
| 2014 | $5,357 | $65,040 | $15,990 | $49,050 |
| 2013 | $5,106 | $65,950 | $16,210 | $49,740 |
Source: Public Records
Map
Nearby Homes
- 417 W Terrace St
- 700 W Pleasant St
- 434 N Lincoln Ave
- 37 N Addison Rd
- 739 N 2nd Ave
- 131 N Chase Ave
- 912 E Saint Charles Rd
- 935 E Saint Charles Rd
- 247 N Ardmore Ave
- 235 N Ardmore Ave
- 1136 E Kenilworth Ave
- 736 E Saint Charles Rd
- 490 N Chatham Ave
- 117 E Vermont St
- 630 E Le Moyne Ave
- 2N152 Wisconsin Ave
- 937 W North Ave Unit C
- 933 W North Ave Unit A
- 439 N Fairfield Ave
- 530 N Fairfield Ave
- 417 N 3rd Ave Unit 417
- 407 N 3rd Ave
- 419 N 3rd Ave Unit 419
- 401 N 3rd Ave
- 416 N Addison Rd
- 412 N Addison Rd
- 408 N 3rd Ave
- 406 N Addison Rd
- 414 N 3rd Ave
- 425 N 3rd Ave
- 416 N 3rd Ave
- 402 N 3rd Ave
- 429 N 3rd Ave
- 350 N Addison Rd
- 426 N Addison Rd
- 426 N 3rd Ave
- 362 N 3rd Ave
- 430 N Addison Rd
- 358 N 3rd Ave
- 430 N 3rd Ave