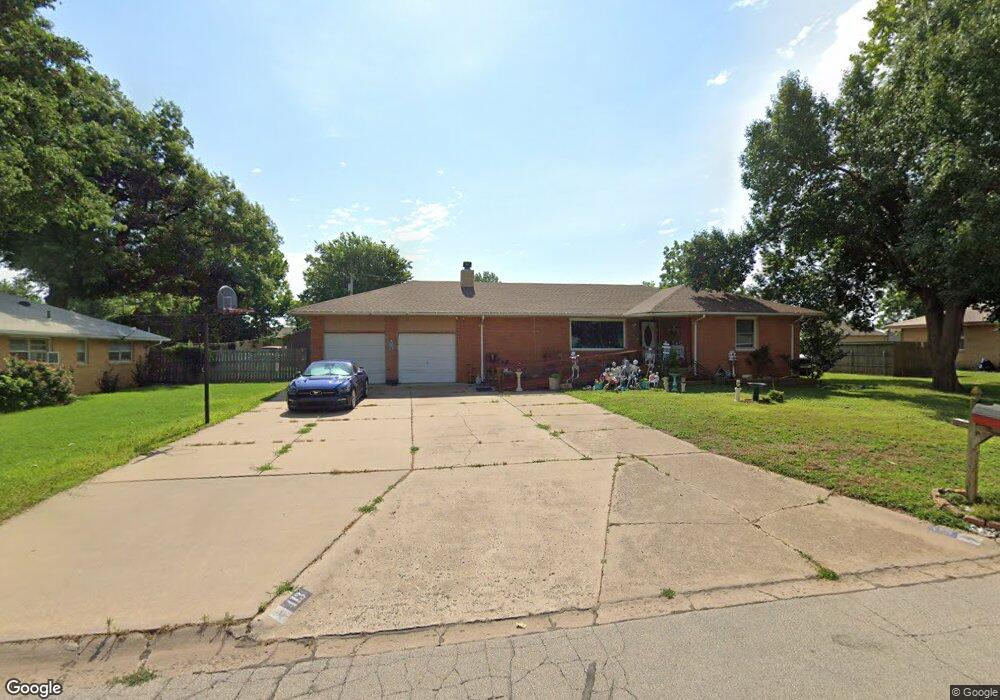
413 N Stephens St Ponca City, OK 74601
Estimated Value: $157,000 - $215,000
3
Beds
1
Bath
2,086
Sq Ft
$85/Sq Ft
Est. Value
About This Home
This home is located at 413 N Stephens St, Ponca City, OK 74601 and is currently estimated at $176,931, approximately $84 per square foot. 413 N Stephens St is a home located in Kay County with nearby schools including Lincoln Elementary School, Ponca City West Middle School, and Ponca City East Middle School.
Ownership History
Date
Name
Owned For
Owner Type
Purchase Details
Closed on
Nov 30, 2015
Sold by
Calicchio Keith P
Bought by
Wiggins Carl W and Wiggins Vyrone R
Current Estimated Value
Home Financials for this Owner
Home Financials are based on the most recent Mortgage that was taken out on this home.
Original Mortgage
$79,000
Outstanding Balance
$62,350
Interest Rate
3.81%
Mortgage Type
New Conventional
Estimated Equity
$114,581
Purchase Details
Closed on
Dec 19, 2012
Sold by
Calicchio Keith P
Bought by
The Keith P Calicchio Revocable Living T
Purchase Details
Closed on
Oct 16, 2009
Sold by
Thilsted David P
Bought by
Calicchio Keith
Purchase Details
Closed on
Sep 18, 1997
Sold by
Helen Charles and Helen Buxton
Bought by
Debora David and Debora Thilsted
Purchase Details
Closed on
Sep 4, 1997
Sold by
Riley J Charter
Bought by
Charles Helen and Charles Buxton
Create a Home Valuation Report for This Property
The Home Valuation Report is an in-depth analysis detailing your home's value as well as a comparison with similar homes in the area
Home Values in the Area
Average Home Value in this Area
Purchase History
| Date | Buyer | Sale Price | Title Company |
|---|---|---|---|
| Wiggins Carl W | $99,000 | None Available | |
| The Keith P Calicchio Revocable Living T | -- | None Available | |
| Calicchio Keith | $63,000 | -- | |
| Debora David | $18,000 | -- | |
| Charles Helen | $10,000 | -- |
Source: Public Records
Mortgage History
| Date | Status | Borrower | Loan Amount |
|---|---|---|---|
| Open | Wiggins Carl W | $79,000 |
Source: Public Records
Tax History Compared to Growth
Tax History
| Year | Tax Paid | Tax Assessment Tax Assessment Total Assessment is a certain percentage of the fair market value that is determined by local assessors to be the total taxable value of land and additions on the property. | Land | Improvement |
|---|---|---|---|---|
| 2024 | $1,019 | $11,767 | $1,298 | $10,469 |
| 2023 | $1,019 | $11,424 | $1,298 | $10,126 |
| 2022 | $947 | $10,952 | $1,298 | $9,654 |
| 2021 | $952 | $10,952 | $1,298 | $9,654 |
| 2020 | $920 | $10,724 | $1,298 | $9,426 |
| 2019 | $899 | $10,412 | $1,298 | $9,114 |
| 2018 | $916 | $10,456 | $1,298 | $9,158 |
| 2017 | $927 | $10,456 | $1,298 | $9,158 |
| 2016 | $979 | $10,889 | $1,119 | $9,770 |
| 2015 | $832 | $8,361 | $796 | $7,565 |
| 2014 | $777 | $7,963 | $814 | $7,149 |
Source: Public Records
Map
Nearby Homes
- 312 N Flormable St
- 1504 W Broadway Ave
- 400 Hampton Dr
- 1035 N Sunset St
- 330 S Lincoln St
- 508 N Birch St
- 1023 W Grand Ave
- 329 S Sunset St
- 802 N Ash St
- 901 W Grand Ave
- 726 N Lake St
- 429 S Sunset St
- 745 N Lake St
- 941 N Ash St
- 1021 Riviera Dr
- 505 N Pine St
- 411 S Elm St
- 1016 N Oak St
- 4025 S Union St
- 401 W Otoe Ave
- 409 N Stephens St
- 501 N Stephens St
- 412 N Olympia St
- 408 N Olympia St
- 500 N Olympia St
- 405 N Stephens St
- 505 N Stephens St
- 412 N Stephens St
- 500 N Stephens St
- 408 N Stephens St
- 404 N Olympia St
- 504 N Olympia St
- 404 N Stephens St
- 509 N Stephens St
- 401 N Stephens St
- 508 N Olympia St
- 400 N Olympia St
- 508 N Stephens St
- 400 N Stephens St
- 413 N Olympia St