Estimated Value: $68,000 - $116,000
2
Beds
1
Bath
2,272
Sq Ft
$37/Sq Ft
Est. Value
About This Home
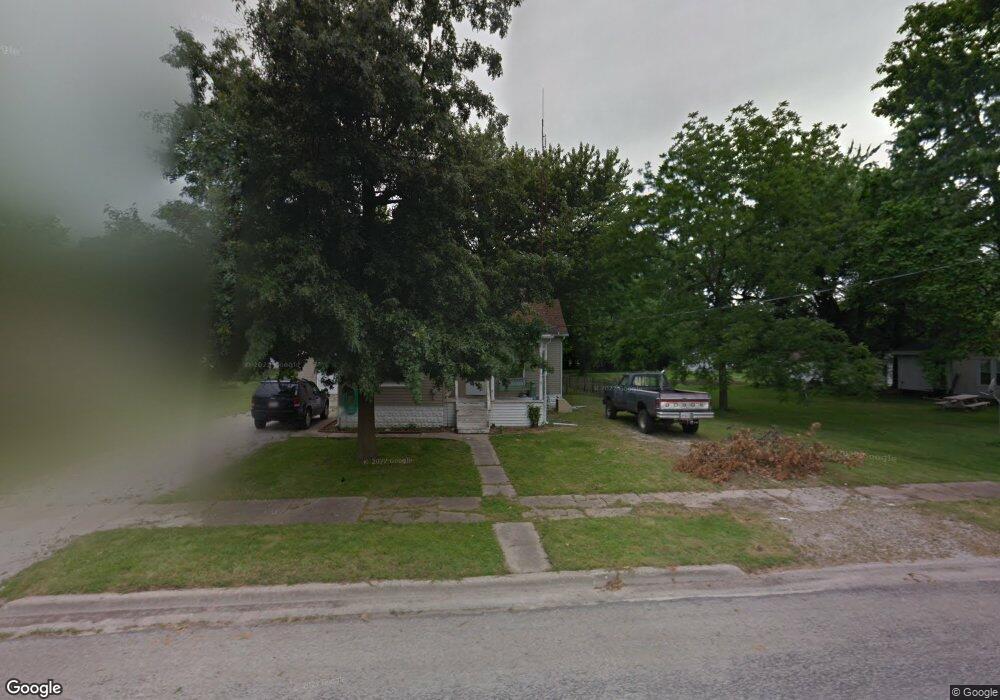
This home is located at 413 N Walnut St, Pana, IL 62557 and is currently estimated at $84,944, approximately $37 per square foot. 413 N Walnut St is a home located in Christian County with nearby schools including Washington Elementary School, Lincoln Elementary School, and Pana Jr High School.
Ownership History
Date
Name
Owned For
Owner Type
Purchase Details
Closed on
Mar 3, 2017
Sold by
Morgason Samuel Wayne and Morgason Allison
Bought by
Smith Robert L and Smith Sharon E
Current Estimated Value
Purchase Details
Closed on
Sep 24, 2010
Sold by
Todd Mark A and Todd Audrey L
Bought by
Morgason Samuel Wayne
Home Financials for this Owner
Home Financials are based on the most recent Mortgage that was taken out on this home.
Original Mortgage
$48,500
Interest Rate
4.42%
Mortgage Type
New Conventional
Purchase Details
Closed on
Feb 3, 2006
Sold by
Barnett David L and Barnett Walter E
Bought by
Todd Mark A and Todd Audrey L
Home Financials for this Owner
Home Financials are based on the most recent Mortgage that was taken out on this home.
Original Mortgage
$29,600
Interest Rate
6.34%
Mortgage Type
New Conventional
Create a Home Valuation Report for This Property
The Home Valuation Report is an in-depth analysis detailing your home's value as well as a comparison with similar homes in the area
Home Values in the Area
Average Home Value in this Area
Purchase History
| Date | Buyer | Sale Price | Title Company |
|---|---|---|---|
| Smith Robert L | $43,500 | Community Title | |
| Morgason Samuel Wayne | $45,000 | None Available | |
| Todd Mark A | $37,000 | Advanced Title Group Inc |
Source: Public Records
Mortgage History
| Date | Status | Borrower | Loan Amount |
|---|---|---|---|
| Previous Owner | Morgason Samuel Wayne | $48,500 | |
| Previous Owner | Todd Mark A | $29,600 |
Source: Public Records
Tax History
| Year | Tax Paid | Tax Assessment Tax Assessment Total Assessment is a certain percentage of the fair market value that is determined by local assessors to be the total taxable value of land and additions on the property. | Land | Improvement |
|---|---|---|---|---|
| 2024 | $751 | $18,734 | $3,803 | $14,931 |
| 2023 | $1,747 | $17,700 | $3,593 | $14,107 |
| 2022 | $1,717 | $16,730 | $3,569 | $13,161 |
| 2021 | $1,680 | $16,402 | $3,499 | $12,903 |
| 2020 | $490 | $15,707 | $3,351 | $12,356 |
| 2019 | $520 | $16,077 | $3,430 | $12,647 |
| 2018 | $586 | $16,742 | $3,355 | $13,387 |
| 2017 | $797 | $17,083 | $3,423 | $13,660 |
| 2016 | $1,699 | $17,035 | $3,413 | $13,622 |
| 2015 | $1,092 | $16,836 | $3,373 | $13,463 |
| 2014 | $958 | $15,660 | $3,137 | $12,523 |
| 2013 | $960 | $15,455 | $3,136 | $12,319 |
| 2011 | $958 | $15,820 | $3,210 | $12,610 |
Source: Public Records
Map
Nearby Homes
- 407 N Walnut St
- 417 N Walnut St
- 419 N Walnut St
- 403 N Walnut St
- 0 S Magnolia & Walnut St Unit MRD12089426
- 0 S Magnolia & Walnut St Unit 6243393
- 500 N State St
- 501 N Walnut St
- 104 Magnolia Ave
- 402 S Walnut St
- 104 W Magnolia St
- 0 N Walnut St
- 106 Magnolia Ave
- 106 W Magnolia St
- 502 N Walnut St
- 505 N Walnut St
- 313 N Walnut St
- 402 N Walnut St
- 202 Hayes Ave
- 505 N State St
Your Personal Tour Guide
Ask me questions while you tour the home.