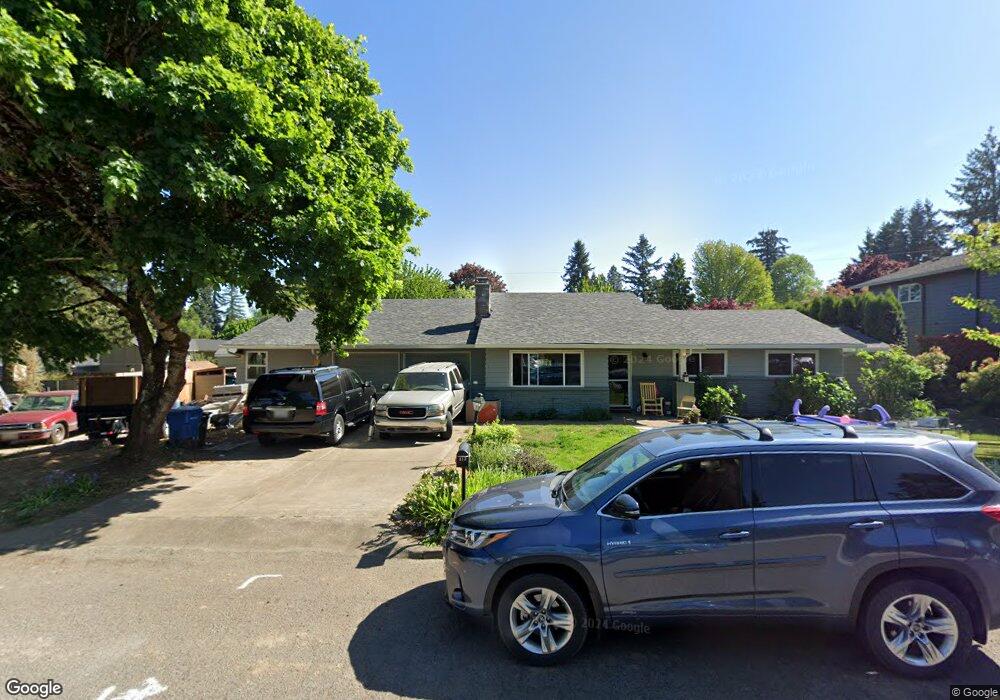
413 NE 110th St Vancouver, WA 98685
Estimated Value: $558,000 - $690,000
3
Beds
2
Baths
1,388
Sq Ft
$447/Sq Ft
Est. Value
About This Home
This home is located at 413 NE 110th St, Vancouver, WA 98685 and is currently estimated at $620,320, approximately $446 per square foot. 413 NE 110th St is a home located in Clark County with nearby schools including Sacajawea Elementary School, Jefferson Middle School, and Columbia River High School.
Ownership History
Date
Name
Owned For
Owner Type
Purchase Details
Closed on
Apr 20, 2010
Sold by
Cook Julianne
Bought by
Long Matthew and Long Jessica A
Current Estimated Value
Home Financials for this Owner
Home Financials are based on the most recent Mortgage that was taken out on this home.
Original Mortgage
$176,739
Outstanding Balance
$118,412
Interest Rate
5.12%
Mortgage Type
FHA
Estimated Equity
$501,908
Purchase Details
Closed on
Jul 21, 2008
Sold by
Cook Julianne and Matthews Julianne L
Bought by
Cook Julianne
Home Financials for this Owner
Home Financials are based on the most recent Mortgage that was taken out on this home.
Original Mortgage
$158,703
Interest Rate
6.41%
Mortgage Type
New Conventional
Purchase Details
Closed on
Nov 8, 2004
Sold by
Matthews William T
Bought by
Matthews Julianne L
Purchase Details
Closed on
Jun 9, 2000
Sold by
Johnston Dorothy B and Buell William E
Bought by
Matthews William T and Matthews Julieanne L
Home Financials for this Owner
Home Financials are based on the most recent Mortgage that was taken out on this home.
Original Mortgage
$123,400
Interest Rate
8.27%
Create a Home Valuation Report for This Property
The Home Valuation Report is an in-depth analysis detailing your home's value as well as a comparison with similar homes in the area
Home Values in the Area
Average Home Value in this Area
Purchase History
| Date | Buyer | Sale Price | Title Company |
|---|---|---|---|
| Long Matthew | $180,000 | Columbia Title Agency | |
| Cook Julianne | -- | Select Title | |
| Matthews Julianne L | -- | -- | |
| Matthews William T | $129,900 | Chicago Title Insurance Co |
Source: Public Records
Mortgage History
| Date | Status | Borrower | Loan Amount |
|---|---|---|---|
| Open | Long Matthew | $176,739 | |
| Previous Owner | Cook Julianne | $158,703 | |
| Previous Owner | Matthews William T | $123,400 |
Source: Public Records
Tax History Compared to Growth
Tax History
| Year | Tax Paid | Tax Assessment Tax Assessment Total Assessment is a certain percentage of the fair market value that is determined by local assessors to be the total taxable value of land and additions on the property. | Land | Improvement |
|---|---|---|---|---|
| 2025 | $6,247 | $615,470 | $180,000 | $435,470 |
| 2024 | $5,835 | $593,567 | $180,000 | $413,567 |
| 2023 | $5,561 | $598,952 | $168,750 | $430,202 |
| 2022 | $5,522 | $565,888 | $211,500 | $354,388 |
| 2021 | $5,342 | $500,848 | $152,405 | $348,443 |
| 2020 | $4,782 | $454,611 | $138,550 | $316,061 |
| 2019 | $3,596 | $432,298 | $139,365 | $292,933 |
| 2018 | $3,239 | $336,254 | $0 | $0 |
| 2017 | $3,008 | $251,802 | $0 | $0 |
| 2016 | $2,870 | $243,299 | $0 | $0 |
| 2015 | $2,828 | $216,928 | $0 | $0 |
| 2014 | -- | $206,282 | $0 | $0 |
| 2013 | -- | $181,402 | $0 | $0 |
Source: Public Records
Map
Nearby Homes
- 208 NE 106th St
- 405 NE 105th St
- 420 NE 103rd St
- 421 NE 105th St Unit 421
- 405 NE 115th Cir
- 701 NE 117th St
- 1211 NE 110th St
- 211 NE 117th St
- 322 NW 103rd St
- 11620 NW 2nd Ct
- 317 NE Bassel Rd
- 10601 NW 7th Ave
- 314 NW 102nd St
- 1110 NE 115th St
- 10707 NW 7th Ave
- 415 NE 99th St
- 102 NW 99th St
- 316 NE Bassel Rd
- 11302 NW 7th Ave
- 415 NW 117th St