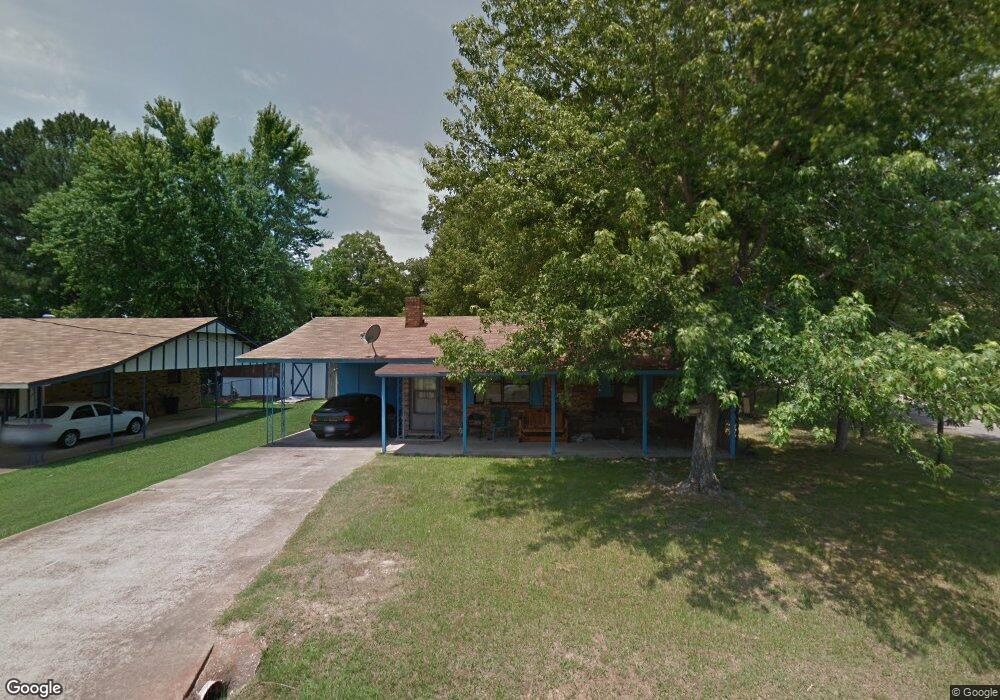
413 NE D St Antlers, OK 74523
Estimated Value: $67,241 - $123,000
2
Beds
1
Bath
962
Sq Ft
$100/Sq Ft
Est. Value
About This Home
This home is located at 413 NE D St, Antlers, OK 74523 and is currently estimated at $96,560, approximately $100 per square foot. 413 NE D St is a home located in Pushmataha County with nearby schools including Brantly Elementary School, Obuch Middle School, and Antlers High School.
Ownership History
Date
Name
Owned For
Owner Type
Purchase Details
Closed on
May 5, 2015
Sold by
Warren Jennifer
Bought by
Stone Elmerine Julia
Current Estimated Value
Purchase Details
Closed on
Mar 4, 2015
Sold by
Moon Kevin C
Bought by
Warren Jennifer
Purchase Details
Closed on
Sep 19, 2014
Sold by
Moon Terry C
Bought by
Warren Jennifer
Purchase Details
Closed on
Mar 14, 2012
Sold by
Brown Nancy E
Bought by
Moon Terry C
Purchase Details
Closed on
Mar 20, 2002
Sold by
Hurt Lavona
Bought by
Brown Nancy E
Purchase Details
Closed on
Jan 21, 1997
Sold by
Garman Bobby
Bought by
Robbins Lavona
Purchase Details
Closed on
Aug 31, 1994
Sold by
Boling Wayne
Bought by
Garman Bobby
Create a Home Valuation Report for This Property
The Home Valuation Report is an in-depth analysis detailing your home's value as well as a comparison with similar homes in the area
Home Values in the Area
Average Home Value in this Area
Purchase History
| Date | Buyer | Sale Price | Title Company |
|---|---|---|---|
| Stone Elmerine Julia | $40,000 | -- | |
| Warren Jennifer | -- | -- | |
| Warren Jennifer | -- | -- | |
| Moon Terry C | -- | -- | |
| Brown Nancy E | $40,000 | -- | |
| Robbins Lavona | $35,000 | -- | |
| Garman Bobby | $28,000 | -- |
Source: Public Records
Tax History Compared to Growth
Tax History
| Year | Tax Paid | Tax Assessment Tax Assessment Total Assessment is a certain percentage of the fair market value that is determined by local assessors to be the total taxable value of land and additions on the property. | Land | Improvement |
|---|---|---|---|---|
| 2025 | $160 | $4,178 | $104 | $4,074 |
| 2024 | $160 | $4,178 | $95 | $4,083 |
| 2023 | $160 | $4,177 | $104 | $4,073 |
| 2022 | $160 | $4,178 | $176 | $4,002 |
| 2021 | $160 | $4,178 | $176 | $4,002 |
| 2020 | $160 | $4,178 | $176 | $4,002 |
| 2019 | $166 | $4,257 | $176 | $4,081 |
| 2018 | $176 | $4,400 | $176 | $4,224 |
| 2017 | $176 | $4,400 | $176 | $4,224 |
| 2016 | $176 | $4,400 | $176 | $4,224 |
| 2015 | $340 | $4,620 | $176 | $4,444 |
| 2014 | $323 | $4,400 | $401 | $3,999 |
Source: Public Records
Map
Nearby Homes